IMAGE

Figure 5

ID
ZDB-IMAGE-240401-31
Source
Figures for Sadamitsu et al., 2024
Image
Figure Caption

Figure 5

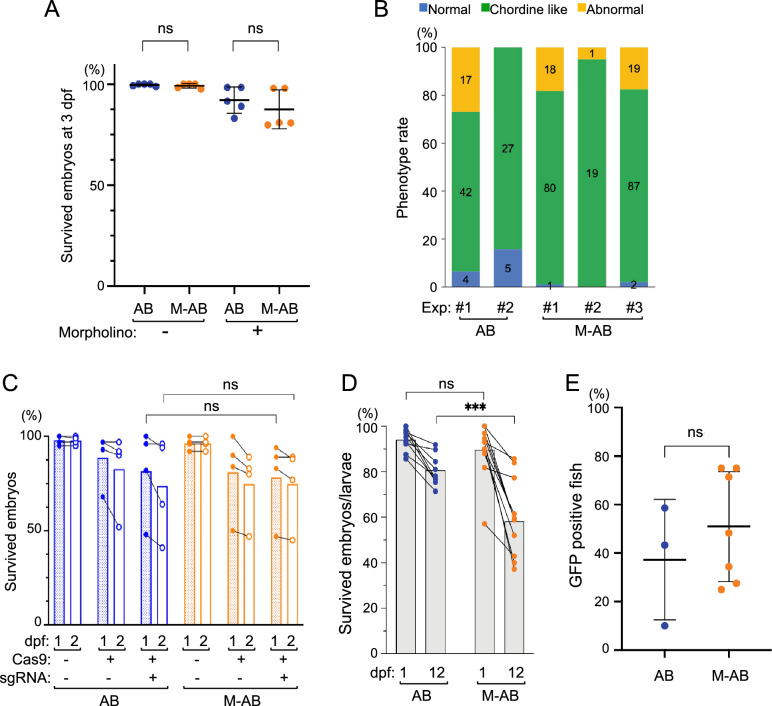
Survival of M-AB embryos was hardly affected by microinjections. (A) Survival of chordin MO-injected M-AB and *AB embryos (n = 5). (B) Approximately 80% of chordin MO-injected embryos showed chordin-deficient phenotypes. The numbers in the color bars indicate the number of samples. (C) Survival of M-AB and *AB embryos injected with sqstm1 sgRNA and/or Cas9 protein (n = 4). (D) Survival of M-AB and *AB embryos/larvae injected with ef1α:EGFP plasmid and tol2 mRNA (n = 9). Plots connected by lines indicate the same experimental group. (E) Percentages of fish (30 dpf) that harbor GFP-transgene detectable by PCR (*AB: n = 3, M-AB: n = 7). Error bars indicate the standard deviation.

Acknowledgments
This image is the copyrighted work of the attributed author or publisher, and ZFIN has permission only to display this image to its users. Additional permissions should be obtained from the applicable author or publisher of the image. Full text @ Sci. Rep.