FIGURE SUMMARY
Title

Embryonic ethanol exposure and optogenetic activation of hypocretin neurons stimulate similar behaviors early in life associated with later alcohol consumption

Authors
Collier, A.D., Yasmin, N., Karatayev, O., Abdulai, A.R., Yu, B., Fam, M., Campbell, S., Leibowitz, S.F.
Source
Full text @ Sci. Rep.

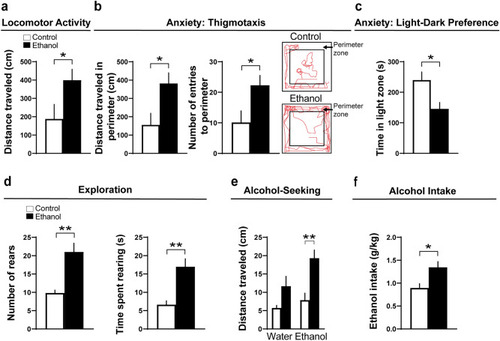
Effects of embryonic ethanol exposure (2 g/kg/day, from E10–E15) compared to control on alcohol-related behaviors, including locomotor activity, anxiety, exploration and alcohol-seeking in pre-weanling female rats and voluntary consumption of alcohol in adolescent female rats. (a) Bar graph shows that embryonic ethanol exposure compared to control increases locomotor activity in an activity chamber in 15-day-old rats, as indicated by increased distance traveled (cm) during a 10-min test. (b) Bar graphs show that ethanol exposure compared to control increases thigmotaxis in 15-day-old rats, an anxiety-like behavior measured by increased distance traveled in the perimeter (cm) and number of entries into the perimeter within an activity chamber during a 10-min test. Representative activity traces shown in red illustrate the activity of a control and ethanol-exposed rat during the locomotor and thigmotaxis tests. (c) Bar graph shows that embryonic ethanol exposure compared to control increases anxiety in 15-day-old rats, as indicated by a decrease in time spent in the light zone during a 10-min light–dark preference test. (d) Bar graphs show that embryonic ethanol exposure increases exploratory behavior in 15-day-old rats, as indicated by increased number of rears and time spent rearing in an activity chamber during a 10-min test. (e) Bar graph shows that embryonic ethanol exposure compared to control increases alcohol-seeking behavior in 12-day-old rats, as indicated by an increased distance traveled (cm) during a 2-min test down a runway while a cotton ball moistened with 6% ethanol was applied directly in front of the rat’s snout but not while a control cotton ball moistened with water was applied. (f) Bar graph shows that embryonic ethanol exposure compared to control in 35-day-old rats increases alcohol consumption as measured using a 20% intermittent-access paradigm. Results are shown as means ± standard errors. *p < 0.05, **p < 0.01.

Effects of embryonic ethanol exposure (0.5% v/v, from 22–24 hpf) compared to control on alcohol-related behaviors, including locomotor activity and anxiety-like behaviors, in larval zebrafish (6 dpf). (a) Bar graph shows that embryonic ethanol exposure compared to control increases locomotor activity in an open-field environment of a 12-well plate, as indicated by increased distance traveled (cm) during a 20-min test. (b) Bar graphs show that ethanol compared to control increases thigmotaxis, an anxiety-like behavior, shown by an increased percent time spent in the perimeter (cm) and number of entries into the perimeter within an open-field environment of a 12-well plate during a 20-min test. Representative activity traces shown in red illustrate the activity of a control and ethanol-exposed zebrafish during the locomotor and thigmotaxis tests, with the white circular outlines illustrating the perimeter zone. (c) Bar graphs show that embryonic ethanol exposure compared to control increases anxiety-like behavior, as indicated by an increased percent time spent in and increased number of entries into the light zone during a 20-min light–dark preference test. Representative activity traces shown in red illustrate the activity of a control and ethanol-exposed zebrafish during the light–dark preference test, with the light zone shown on the left half and dark zone shown on the right half of the well. Under visible light conditions, the dark zone is black in color. Results are shown as means ± standard errors. *p < 0.05, ***p < 0.001, ***p < 0.0001. hpf, hours post fertilization; dpf, days post fertilization.

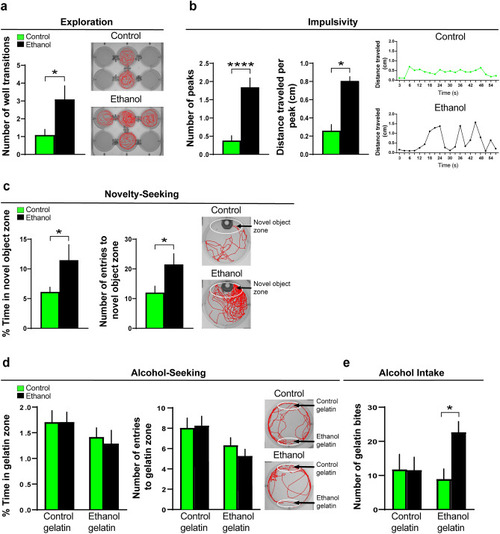
Effects of embryonic ethanol exposure (0.5% v/v, from 22 to 24 hpf) compared to control on alcohol-related behaviors, including exploration, impulsivity, novelty-seeking and alcohol-seeking in 6 dpf zebrafish and voluntary intake of ethanol-gelatin in juvenile zebrafish (30 dpf). (a) Bar graph shows that embryonic ethanol exposure compared to control increases exploration in a 6-well environment of a 12-well plate, with channels between the 6 wells allowing for free movement between the wells, as indicated by an increase in number of well transitions during a 20-min test in larval zebrafish. (b) Bar graphs show that ethanol compared to control increases motor impulsivity over a 1-min period, shown by an increased number of swimming “peaks” (defined as events when the fish traveled more than 0.5 cm in less than 12 s) and increased distance traveled (cm) during each of these peaks in larval zebrafish. Representative line graphs illustrate in ethanol-exposed (black line) compared to control (green line) zebrafish an increased number of peaks and distance traveled per peak. (c) Bar graphs show that embryonic ethanol exposure compared to control increases novelty-seeking behavior in larval zebrafish, as indicated by increased percent time spent in and increased number of entries into the novel object zone during a 20-min test. Representative activity traces shown in red illustrate the activity of a control and ethanol-exposed zebrafish, with the novel-object zone outlined by white at the top of the well surrounding the novel-object consisting of a piece of green-color plastic pipette tip. (d) Bar graphs show that embryonic ethanol exposure compared to control has no effect on alcohol-seeking behavior in larval zebrafish, as shown by no change in percent time spent in and number of entries into the ethanol-gelatin as well as control-gelatin zones during the 20-min test. Representative activity traces shown in red illustrate the activity of a control and ethanol-exposed zebrafish, with the control-gelatin zone outlined by white and shown at the top of the well of a 6-well plate and the ethanol-gelatin zone outlined by white and shown at the bottom of the well. (e) Bar graphs show that embryonic ethanol exposure compared to control increases alcohol consumption in juvenile zebrafish, as shown by increased number of bites taken of the ethanol-gelatin but not of the control-gelatin. Results are shown as means ± standard errors. *p < 0.05, ***p < 0.0001. hpf hours post fertilization, dpf days post fertilization.

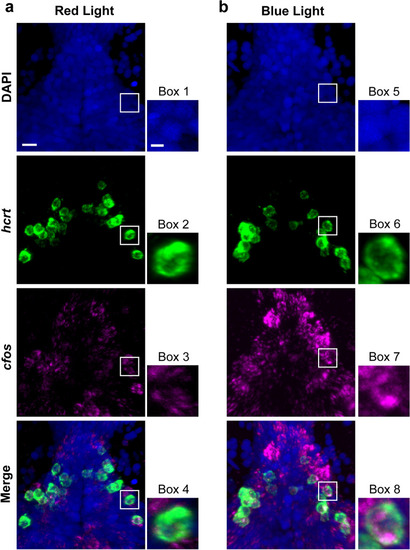
Representative photomicrographs illustrating increased colocalization of transcripts of the immediate early gene cfos, a marker of neuronal activation, within hcrt neurons after optogenetic activation with blue light exposure in the brains of transgenic Hcrt:ChR2-EYFP54 larval zebrafish (6 dpf) using RNAscope staining. (a) Representative confocal photomicrograph (×25) illustrates the 6 dpf zebrafish brain in a dorsal/ventral view after 20-min of red-light exposure, a wavelength of light that fails to optogenetically activate Hcrt neurons. Brains were counterstained by DAPI (blue) and labeled for hcrt (green) and cfos (magenta), with merged photos showing an overlay of each channel and boxes showing single-cell enlargements of DAPI (Box 1), hcrt (Box 2), cfos (Box 3), and the merge of each channel (Box 4) showing a weak colocalization between cfos and hcrt. (b) Representative confocal photomicrograph (×25) illustrates the 6 dpf zebrafish brain in a dorsal/ventral view after 30-min of blue-light exposure, a wavelength of light that optogenetically activates Hcrt neurons. Brains were counterstained by DAPI (blue) and labeled for hcrt (green) and cfos (magenta), with merged photos showing an overlay of each channel and boxes showing single-cell enlargements of DAPI (Box 5), hcrt (Box 6), cfos (Box 7), and the merge of each channel (Box 8) showing strong colocalization between cfos and hcrt. Scale bars: low-magnification, 10 µm, high-magnification, 2 µm. dpf, days post fertilization.

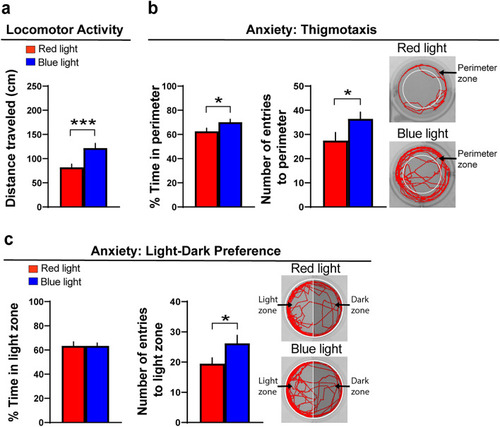
Effects of optogenetic activation of Hcrt neurons on alcohol-related behaviors, including locomotor activity and anxiety, in transgenic Hcrt:ChR2-EYFP54 larval zebrafish (6 dpf). (a) Bar graph shows that optogenetic activation of Hcrt neurons by blue-light compared to red-light exposure increases locomotor activity in an open-field environment of a 12-well plate, as indicated by increased distance traveled (cm) during a 20-min test. (b) Bar graphs show that blue-light compared to red-light exposure increases thigmotaxis, an anxiety-like behavior, shown by increased percent time spent in the perimeter (cm) and increased number of entries into the perimeter of an open-field environment of a 12-well plate during a 20-min test. Representative activity traces shown in red illustrate the activity of a red- and blue-light-exposed zebrafish during the locomotor and thigmotaxis tests, with the white circular outlines illustrating the perimeter zone. (c) Bar graphs show that blue-light compared to red-light exposure, while having no effect on percent time spent in the light zone, increases the number of entries to the light zone during a 20-min light–dark preference test. Representative activity traces shown in red illustrate the activity of a zebrafish exposed to a red or blue light during the light–dark preference test, with the light zone shown on the left half and the dark zone shown on the right half of the well. Under visible light conditions, the dark zone is black in color. Results are shown as means ± standard errors. *p < 0.05, ***p < 0.001. hpf hours post fertilization, dpf days post fertilization.

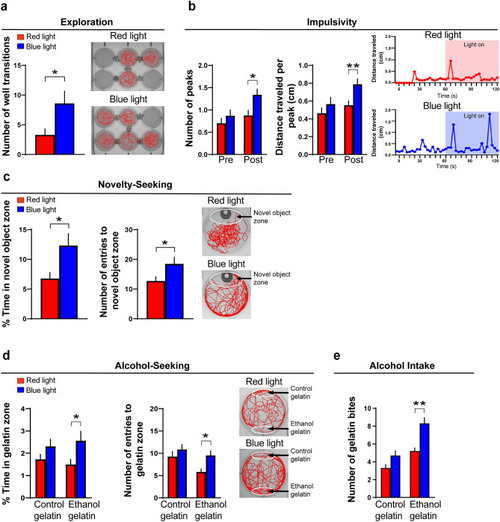
Effects of optogenetic activation of Hcrt neurons in transgenic Hcrt:ChR2-EYFP54 zebrafish on alcohol-related behaviors, including exploration, impulsivity, novelty-seeking and alcohol-seeking in larval zebrafish (6 dpf) and voluntary intake of alcohol-gelatin in juvenile zebrafish (30 dpf). (a) Bar graph shows that optogenetic activation of Hcrt neurons by blue-light compared to red-light exposure increases exploration within a 6-well environment of a 12-well plate (containing channels between the 6 wells that allow for free movement between wells), as indicated by increased number of well transitions during a 20-min test in larval zebrafish. (b) Bar graphs show that blue-light compared to red-light exposure increases motor impulsivity in larval zebrafish over a 1-min period post-light but not pre-light exposure, shown by an increased number of swimming “peaks” defined as events when the fish traveled more than 0.5 cm in less than 12 s and by increased distance traveled (cm) during each of these peaks. Representative line graphs show with a red line the distance traveled (cm) by a red-light exposed zebrafish, both before and after the light is turned on, and with a blue line the distance traveled (cm) by a blue-light exposed zebrafish, both before and after the light is turned on. (c) Bar graphs show that blue-light compared to red-light exposure increases novelty-seeking behavior in larval zebrafish, as shown by an increase in percent time spent in the novel-object zone and increased number of entries into the novel object zone during a 20-min test. Representative activity traces shown in red illustrate the activity of a red-light and blue-light-exposed zebrafish, with the novel-object zone outlined by white at the top of the well surrounding the novel-object consisting of a piece of green-color plastic pipette tip. (d) Bar graphs show that blue-light compared to red-light exposure increases alcohol-seeking behavior in larval zebrafish, as indicated by an increase in percent time spent in and increase in number of entries into the ethanol-gelatin zone but no change in percent time spent in or entries into the control-gelatin zone during the 20-min test. Representative activity traces shown in red illustrate the activity of a red or blue light exposed zebrafish, with the control-gelatin zone outlined by white and shown at the top of the well of a 6-well plate and the ethanol-gelatin zone outlined by white and shown at the bottom of the well. (e) Bar graphs show that blue-light compared to red-light exposure increases voluntary alcohol consumption in juvenile zebrafish, as shown by an increased number of bites taken of the ethanol-gelatin but no change in number of bites taken of the control-gelatin. Results are shown as means ± standard errors. *p < 0.05, **p < 0.01. dpf days post fertilization.

Acknowledgments
This image is the copyrighted work of the attributed author or publisher, and ZFIN has permission only to display this image to its users. Additional permissions should be obtained from the applicable author or publisher of the image. Full text @ Sci. Rep.