IMAGE

Figure 3

ID
ZDB-IMAGE-240211-24
Source
Figures for Collier et al., 2024
Image
Figure Caption

Figure 3

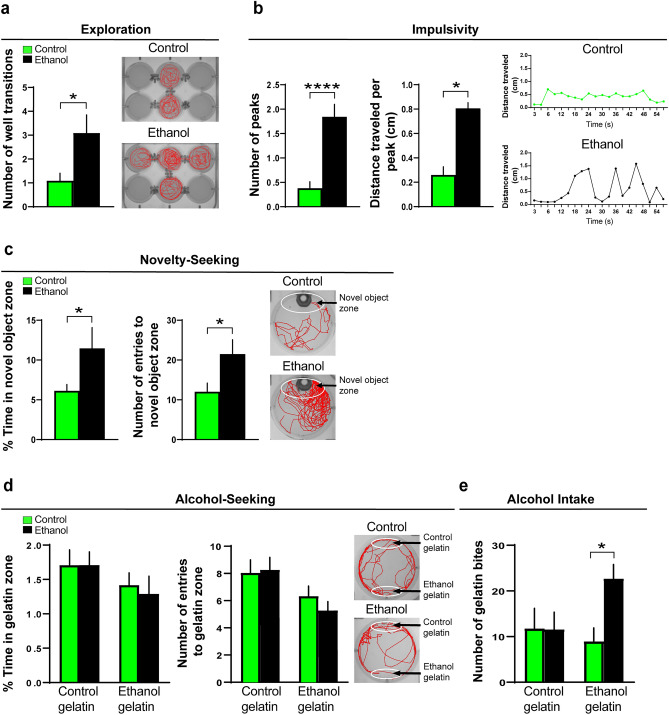
Effects of embryonic ethanol exposure (0.5% v/v, from 22 to 24 hpf) compared to control on alcohol-related behaviors, including exploration, impulsivity, novelty-seeking and alcohol-seeking in 6 dpf zebrafish and voluntary intake of ethanol-gelatin in juvenile zebrafish (30 dpf). (a) Bar graph shows that embryonic ethanol exposure compared to control increases exploration in a 6-well environment of a 12-well plate, with channels between the 6 wells allowing for free movement between the wells, as indicated by an increase in number of well transitions during a 20-min test in larval zebrafish. (b) Bar graphs show that ethanol compared to control increases motor impulsivity over a 1-min period, shown by an increased number of swimming “peaks” (defined as events when the fish traveled more than 0.5 cm in less than 12 s) and increased distance traveled (cm) during each of these peaks in larval zebrafish. Representative line graphs illustrate in ethanol-exposed (black line) compared to control (green line) zebrafish an increased number of peaks and distance traveled per peak. (c) Bar graphs show that embryonic ethanol exposure compared to control increases novelty-seeking behavior in larval zebrafish, as indicated by increased percent time spent in and increased number of entries into the novel object zone during a 20-min test. Representative activity traces shown in red illustrate the activity of a control and ethanol-exposed zebrafish, with the novel-object zone outlined by white at the top of the well surrounding the novel-object consisting of a piece of green-color plastic pipette tip. (d) Bar graphs show that embryonic ethanol exposure compared to control has no effect on alcohol-seeking behavior in larval zebrafish, as shown by no change in percent time spent in and number of entries into the ethanol-gelatin as well as control-gelatin zones during the 20-min test. Representative activity traces shown in red illustrate the activity of a control and ethanol-exposed zebrafish, with the control-gelatin zone outlined by white and shown at the top of the well of a 6-well plate and the ethanol-gelatin zone outlined by white and shown at the bottom of the well. (e) Bar graphs show that embryonic ethanol exposure compared to control increases alcohol consumption in juvenile zebrafish, as shown by increased number of bites taken of the ethanol-gelatin but not of the control-gelatin. Results are shown as means ± standard errors. *p < 0.05, ***p < 0.0001. hpf hours post fertilization, dpf days post fertilization.

Acknowledgments
This image is the copyrighted work of the attributed author or publisher, and ZFIN has permission only to display this image to its users. Additional permissions should be obtained from the applicable author or publisher of the image. Full text @ Sci. Rep.