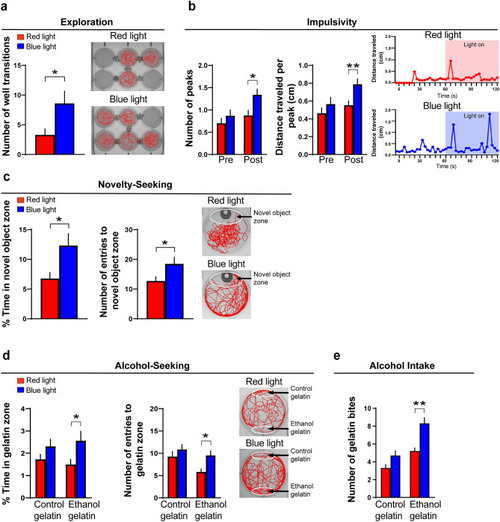
Effects of optogenetic activation of Hcrt neurons in transgenic Hcrt:ChR2-EYFP54 zebrafish on alcohol-related behaviors, including exploration, impulsivity, novelty-seeking and alcohol-seeking in larval zebrafish (6 dpf) and voluntary intake of alcohol-gelatin in juvenile zebrafish (30 dpf). (a) Bar graph shows that optogenetic activation of Hcrt neurons by blue-light compared to red-light exposure increases exploration within a 6-well environment of a 12-well plate (containing channels between the 6 wells that allow for free movement between wells), as indicated by increased number of well transitions during a 20-min test in larval zebrafish. (b) Bar graphs show that blue-light compared to red-light exposure increases motor impulsivity in larval zebrafish over a 1-min period post-light but not pre-light exposure, shown by an increased number of swimming “peaks” defined as events when the fish traveled more than 0.5 cm in less than 12 s and by increased distance traveled (cm) during each of these peaks. Representative line graphs show with a red line the distance traveled (cm) by a red-light exposed zebrafish, both before and after the light is turned on, and with a blue line the distance traveled (cm) by a blue-light exposed zebrafish, both before and after the light is turned on. (c) Bar graphs show that blue-light compared to red-light exposure increases novelty-seeking behavior in larval zebrafish, as shown by an increase in percent time spent in the novel-object zone and increased number of entries into the novel object zone during a 20-min test. Representative activity traces shown in red illustrate the activity of a red-light and blue-light-exposed zebrafish, with the novel-object zone outlined by white at the top of the well surrounding the novel-object consisting of a piece of green-color plastic pipette tip. (d) Bar graphs show that blue-light compared to red-light exposure increases alcohol-seeking behavior in larval zebrafish, as indicated by an increase in percent time spent in and increase in number of entries into the ethanol-gelatin zone but no change in percent time spent in or entries into the control-gelatin zone during the 20-min test. Representative activity traces shown in red illustrate the activity of a red or blue light exposed zebrafish, with the control-gelatin zone outlined by white and shown at the top of the well of a 6-well plate and the ethanol-gelatin zone outlined by white and shown at the bottom of the well. (e) Bar graphs show that blue-light compared to red-light exposure increases voluntary alcohol consumption in juvenile zebrafish, as shown by an increased number of bites taken of the ethanol-gelatin but no change in number of bites taken of the control-gelatin. Results are shown as means ± standard errors. *p < 0.05, **p < 0.01. dpf days post fertilization.
|
