FIGURE SUMMARY
Title

Novel loss-of-function variants expand ABCC9-related intellectual disability and myopathy syndrome

Authors
Efthymiou, S., Scala, M., Nagaraj, V., Ochenkowska, K., Komdeur, F.L., Liang, R.A., Abdel-Hamid, M.S., Sultan, T., Barøy, T., Van Ghelue, M., Vona, B., Maroofian, R., Zafar, F., Alkuraya, F.S., Zaki, M.S., Severino, M., Duru, K.C., Tryon, R.C., Brauteset, L.V., Ansari, M., Hamilton, M., van Haelst, M.M., van Haaften, G., Zara, F., Houlden, H., Samarut, É., Nichols, C.G., Smeland, M.F., McClenaghan, C.
Source
Full text @ Brain

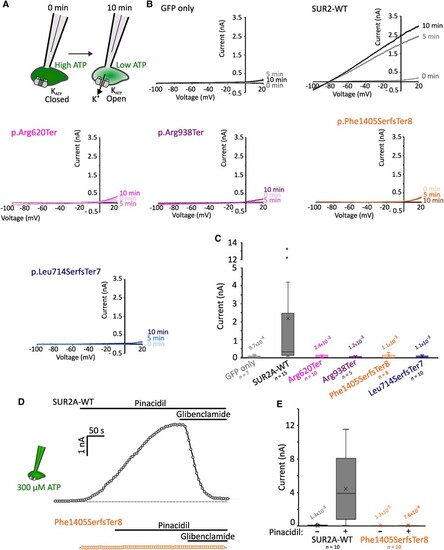
AIMS associated mutations cause complete KATP channel loss-of-function. (A) Whole-cell patch clamp recordings were performed in HEK293 cells transfected with Kir6.2 and wild-type (WT) or mutant SUR2A. Initial ambient levels of intracellular ATP means channels are inhibited immediately after membrane rupture to whole-cell configuration. Over time, ATP levels are depleted by dilution with the pipette solution. (B) Example current traces from voltage ramps for cells transfected with GFP alone, or Kir6.2 alongside SUR2A-WT, SUR2[Arg620Ter], SUR2[Arg938Ter], SUR2[Phe1405SerfsTer8] or SUR2[Leu714SerfsTer7]. (C) Summary showing whole-cell currents at 0 mV measured at 10 min after establishing the whole-cell recording configuration. Box and whisker plot shows median as horizontal line, mean as ‘X’, and interquartile range as coloured box. P-values from Dunn’s pairwise comparisons versus SUR2A-WT following Kruskal-Wallis test shown. (D) KATP currents were recorded from cells transfected with Kir6.2 and SUR2A-WT (top, grey) or SUR2[Phe1405SerfsTer8] (bottom, orange). Whole cell currents were recorded from ramp protocols as shown above with 300 µM ATP included in the patch pipette. Currents at 0 mV from sweeps recorded at 5-s intervals are shown. KATP channels from SUR2A-WT expressing cells displayed robust activation upon administration of 100 µM pinacidil, which was reversed by the KATP inhibitor glibenclamide (10 µM). Dotted line shows zero current level. (E) Summary of currents recorded prior to and after pinacidil administration in cells transfected with Kir6.2 and SUR2A-WT or SUR2[Phe1405SerfsTer8]. P-values from Dunn’s pairwise comparisons versus SUR2A-WT currents in pinacidil following Kruskal-Wallis test shown. GFP = green fluorescent protein.

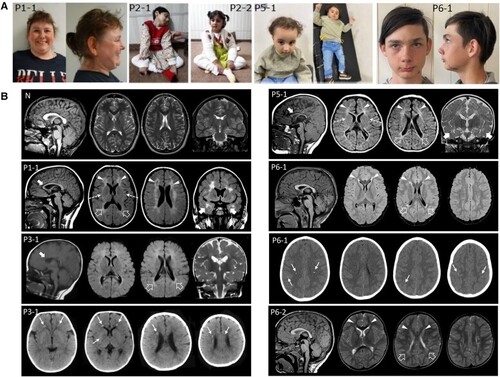
Clinical features and neuroradiological phenotype of ABCC9 patients. (A) Clinical photographs. Patient 1-1 at age 30 exhibits hypotelorism, broad nasal tip and large frontal incisors. Patients 2-1 and 2-2 show a variable association of cognitive impairment and spasticity, with a more severe involvement and decerebrate posture in Patient 2-1. Patient 5-1 shows microcephaly, hypotonia, spasticity, drooling and kyphosis. She also has dysmorphic features consisting of bossing forehead, sparse thin hair, epicanthic folds, prominent nose, retrognathia and low set ears. Patient 6-1 at age 13 shows synophrys, anteverted nostrils, thin upper lip and small chin. Epidermal scar-like nevus left cheek. (B) Neuroimaging findings of patients compared with a normal control. Brain MRI studies with sagittal T1-weighted (far left image), axial T2 or fluid-attenuated inversion recovery (FLAIR) (middle two images) and coronal T2 or FLAIR images (far right image) performed in Patient 1-1 at 15 years of age, Patient 3-1 at 9 months of age, Patient 5-1 at 10 months of age, Patient 6-1 at 7 years of age, and Patient 6-2 at 1 years and 8 months of age. Head CT, axial images, performed in Patients 3-1 and 6-1 at 6 months and 7 years, respectively. There is reduction of parieto-occipital white matter volume with T2/FLAIR hyperintensities and squared-appearance of the lateral ventricles in all subjects (empty arrows). The signal abnormalities extend to the frontal lobes in Patients 1-1, 5-1, 6-1 and 6-2 (arrowheads) and to the anterior temporal regions in Patients 1-1 and 5-1 (thick arrows). Note the small cavitations in the frontal regions in Patient 1-1 and the involvement of the anterior portions of the external capsules (dashed arrows) in Patients 1-1 and 5-1. The corpus callosum is thin in Patients 1-1, 3-1 and 5-1 (curved arrows). Axial CT images reveal multiple small calcifications at the level of the frontal periventricular white matter and right putamen in Patient 3-1 and at the level of the fronto-parietal white matter and cortex in Patient 6-1 (thin arrows).

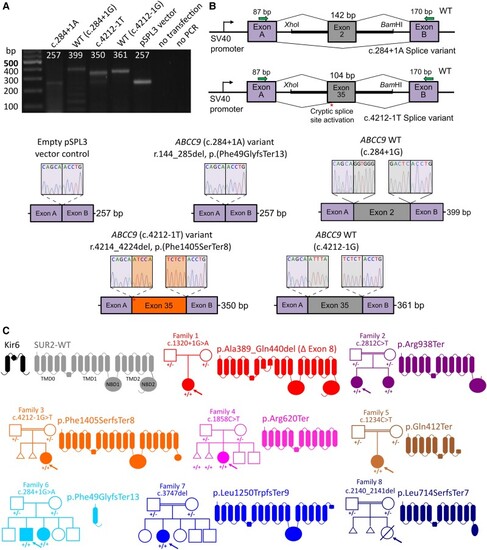
Molecular consequences of ABCC9 variants in AIMS individuals. (A) Agarose gel electrophoresis of RT-PCR products showing amplicons from cells transfected with pSPL3 minigene vectors containing either the ABCC9 c.284+1A or c.4212-1T variant, wild-type (WT) ABCC9 sequences or the pSPL3 vector alone with no ABCC9 insertion. (B) Schematic representation of the mini-gene construct (top right). Exon 2 or 35 of ABCC9 with the flanking 5′ and 3′ intronic regions was inserted between exon A and exon B of the pSPL3 vector. Sanger sequencing of the RT-PCR amplicons revealed that the c.284+1A variant results in skipping of exon 2 and the c.4212-1T variant resulted in activation of a cryptic splice site resulting in exclusion of 11 bases from exon 37 and the predicted p.(Phe1405SerfsTer8) frameshift. Canonical splicing of wild-type ABCC9-containing vector resulted in inclusion of full-length exon 2 or 35. RT-PCR from cells transfected with the empty pSPL3 vector (i.e. no ABCC9 sequence inserted) resulted in the expected amplification of the pSPL3 exons A and B only. (C) KATP channels assemble as octameric complexes with four Kir6 subunits (black) and four SUR subunits (grey). SUR subunits comprise 17 transmembrane domains in three domains (TMD0, TMD1 and TMD2) and two intracellular nucleotide binding domains (NBD1 and NBD2). All variants identified in affected AIMS individuals are predicted or shown to result in splicing defects and major in-frame deletion, or in premature stop codons. Family pedigrees shown for each case; arrow denotes proband.

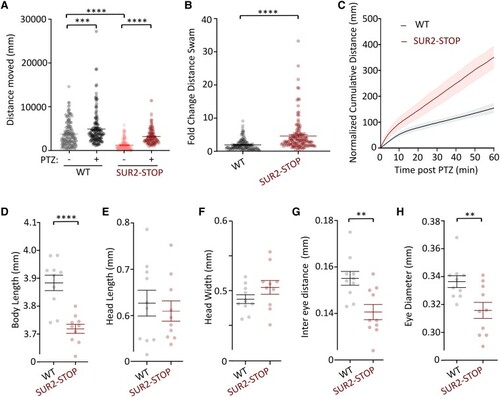
SUR2-STOP zebrafish larvae exhibit increased seizure susceptibility and dysmorphology. (A) Automated swim tracking was used to measure motility in loss-of-function (LoF) SUR2-STOP fish and wild-type (WT) controls. Swimming distances prior to pentylenetetrazole (PTZ; 3 mM) administration (−) and after PTZ (+) shown. Data from individual measurements from biological replicates as dots with mean and standard error of the mean (SEM) shown. Measurements were made and combined from three separate breeding clutches. ***P < 0.001, ****P < 0.0001 from Tukey tests following one-way ANOVA. (B) Swimming distance for each larva after PTZ administration was normalized to basal activity prior to PTZ. Data from individual measurements from biological replicates shown as dots with mean and SEM shown. ****P < 0.0001 according to unpaired t-test. (C) Plot showing the cumulative distance swam for wild-type and SUR2-STOP larvae after PTZ administration. Swimming distances are normalized to the average swimming distances for each genotype over 30 s prior to PTZ admin. Data shown as mean (solid line) and SEM as shaded bars. (DH) Morphometric analysis of wild-type and SUR2-STOP larvae showing reduced body length (D), equivalent head dimensions (E and F) and reduced inter-eye and eye diameter measurements (G and H) in SUR2-STOP larvae. Data from individual measurements from biological replicates as dots with mean and SEM shown. **P < 0.01 and ****P < 0.0001 according to unpaired t-tests.

Acknowledgments
This image is the copyrighted work of the attributed author or publisher, and ZFIN has permission only to display this image to its users. Additional permissions should be obtained from the applicable author or publisher of the image. Full text @ Brain