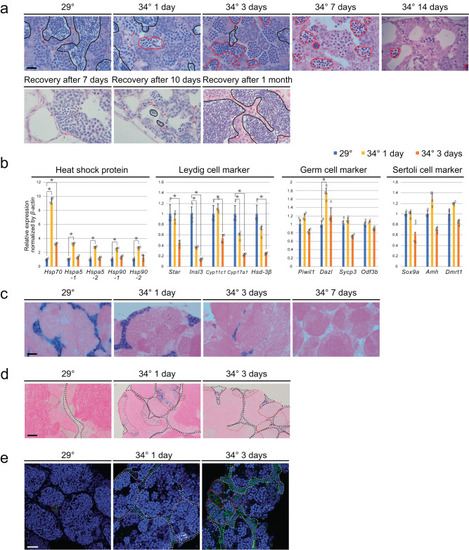
High-temperature treatment led to significant apoptosis of Leydig cells.

a Top row: HE staining of testes. The black lines indicate areas containing E3 spermatid. The red lines indicate areas containing abnormal cell populations. Arrows indicate interstitial tissue. Interstitial areas decreased at 3, 7, and 14 days of temperature stimulation. Bottom row: Recovery of spermatogenesis and interstitial areas from temperature stimulation. The abnormal cell population disappeared, and E3 spermatid and interstitial areas were observed. b qRT-PCR analysis in testes. Values are the mean ± SEM (n = 4). *p < 0.01 compared with the 29 °C testes. c In situ hybridization of Insl3, a Leydig cell marker, in testes. d In situ hybridization of Hspa5. Black broken lines indicate interstitial cells and red broken lines indicate spermatocyte cells. e Localization of cleaved caspase 3. White broken lines indicate interstitial cells and red broken lines indicate spermatocyte cells. Scale bars are 20 μm.

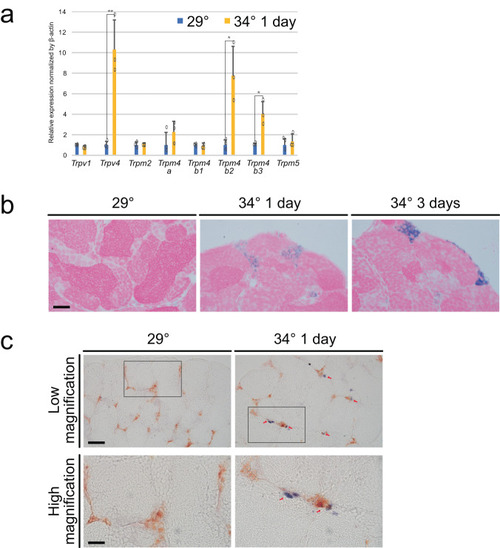
Higher temperature led to upregulated expression of
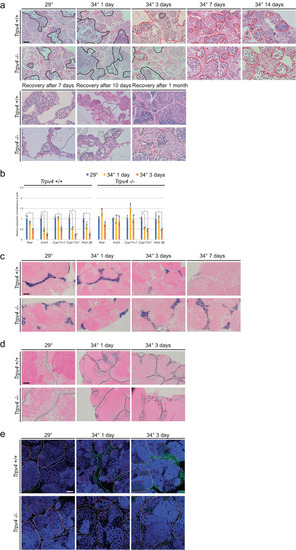
 Trpv4 in Leydig cells.

a qRT-PCR analysis of Trp family genes in the testes. Values are the mean ± SEM (n = 3). **p < 0.01 and *p < 0.05 compared with the 29 °C testis. b In situ hybridization of Trpv4 in testes. c Double in situ hybridization of Trpv4 (blue) and Insl3 (yellow). The insets were magnified in the bottom rows. Scale bars are 20 μm (b and c: high magnification) and 50 μm (c: low magnification).

Leydig cells in Trpv4 KOs did not undergo apoptosis in high temperature.

a HE staining of testes. The upper panels show Trpv4+/+ and the lower panels show Trpv4−/−. Black line indicates areas of E3 spermatid. Red line indicates an abnormal cell population. Arrows indicate interstitial tissue. Interstitial tissue can be detected clearly in Trpv4−/− after 7 and 14 days of temperature stimulation. b qRT-PCR analysis of Leydig cell marker genes in testes. Values are the mean ± SEM (n = 4). *p < 0.01 compared with the 29 °C testis. c In situ hybridization in testes of Isl3, which is a Leydig cell marker. d In situ hybridization of Hspa5. Black broken lines indicate interstitial cells and red broken lines indicate spermatocyte cells. e Localization of cleaved caspase 3. White broken lines indicate interstitial cells and red broken lines indicate spermatocyte cells. Scale bars are 20 μm.

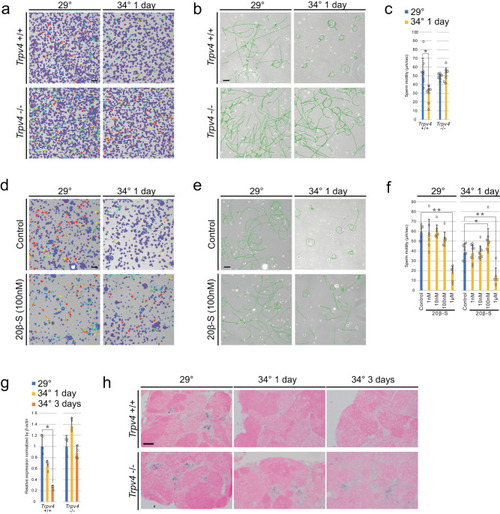
Higher temperature impaired sperm motility in Trpv4+/+ but not in Trpv4−/−.

a Heat map images of sperm motility. Red indicates high motility. Light blue indicates low motility. b Tracking of sperm swimming. The green line shows the trajectory of sperm in 3 s. c Pooled data of sperm motility in two groups. Values are the mean ± SEM (n = 8). *p < 0.01 compared with the 29 °C. d Heat map images of sperm motility with the addition of 100 nM 20β-S. Red indicates high motility; light blue indicates low motility. e Tracking of sperm swimming with the addition of 100 nM 20β-S. f Averaged sperm motility in added 20β-S. Values are the mean ± SEM (29 °C n = 7 and 34 °C n = 6). **p < 0.01 and *p < 0.05 compared with the 29 °C. g qRT-PCR analysis of the 20β-Hsd gene in the testes. Values are the mean ± SEM (n = 4). *p < 0.01 compared with the 29 °C testis. h In situ hybridization of 20β-hsd. Scale bars are 50 μm (a, b, d, and e) and 20 μm (h).

Sperm matured at high temperature showed an abnormality.

a Flow cytometric analysis of sperm DNA content. PI luminance values (30–42) were set as the P4 gate. b Percentage of sperm within the P4 gate. Values are the mean ± SEM (n = 6). *p < 0.01 compared with the 29 °C sperm. c Fertilization rates of 34 °C exposed male. Values are the mean ± SEM (29 °C n = 4 and 34 °C n = 5). **p < 0.01 and *p < 0.05 compared two groups. d Survival rates of embryos derived from 34 °C exposed males. Values are the mean ± SEM (29 °C n = 4 and 34 °C n = 5). *p < 0.01 compared with the 29 °C sperm. e Percentage of morphologically abnormal embryos derived from 34 °C exposed males. Values are the mean ± SEM (29 °C n = 4 and 34 °C n = 5). *p < 0.01 compared with the 29 °C sperm. f Images of embryos at 2 dpf and 6 dpf. Scale bars are 500 μm.

Acknowledgments
This image is the copyrighted work of the attributed author or publisher, and ZFIN has permission only to display this image to its users. Additional permissions should be obtained from the applicable author or publisher of the image. Full text @ Commun Biol