IMAGE

Fig. 4

ID
ZDB-IMAGE-240116-10
Source
Figures for Yamamoto et al., 2024
Image
Figure Caption

Fig. 4 
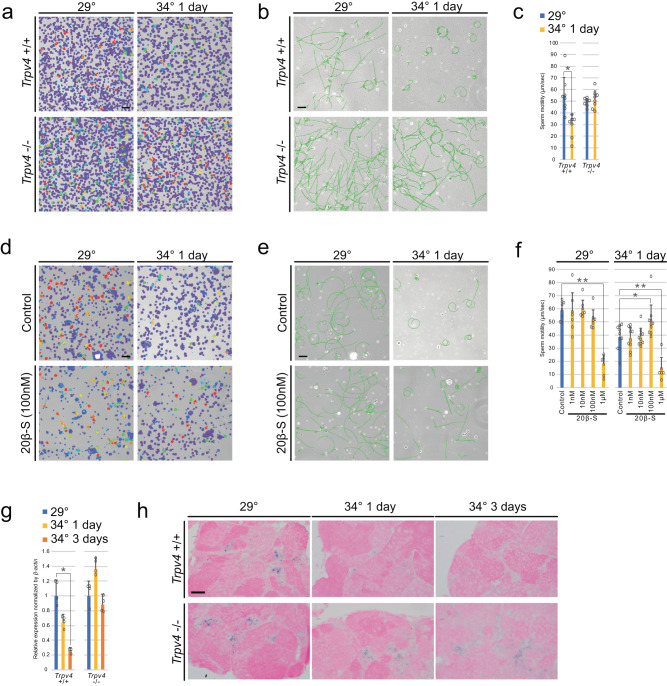
Higher temperature impaired sperm motility in Trpv4+/+ but not in Trpv4−/−.

a Heat map images of sperm motility. Red indicates high motility. Light blue indicates low motility. b Tracking of sperm swimming. The green line shows the trajectory of sperm in 3 s. c Pooled data of sperm motility in two groups. Values are the mean ± SEM (n = 8). *p < 0.01 compared with the 29 °C. d Heat map images of sperm motility with the addition of 100 nM 20β-S. Red indicates high motility; light blue indicates low motility. e Tracking of sperm swimming with the addition of 100 nM 20β-S. f Averaged sperm motility in added 20β-S. Values are the mean ± SEM (29 °C n = 7 and 34 °C n = 6). **p < 0.01 and *p < 0.05 compared with the 29 °C. g qRT-PCR analysis of the 20β-Hsd gene in the testes. Values are the mean ± SEM (n = 4). *p < 0.01 compared with the 29 °C testis. h In situ hybridization of 20β-hsd. Scale bars are 50 μm (a, b, d, and e) and 20 μm (h).

Acknowledgments
This image is the copyrighted work of the attributed author or publisher, and ZFIN has permission only to display this image to its users. Additional permissions should be obtained from the applicable author or publisher of the image. Full text @ Commun Biol