FIGURE SUMMARY
Title

Characterization and Exploration of the Neuroprotective Potential of Oat-Protein-Derived Peptides in PC12 Cells and Scopolamine-Treated Zebrafish

Authors
Rafique, H., Hu, X., Ren, T., Dong, R., Aadil, R.M., Zou, L., Sharif, M.K., Li, L.
Source
Full text @ Nutrients

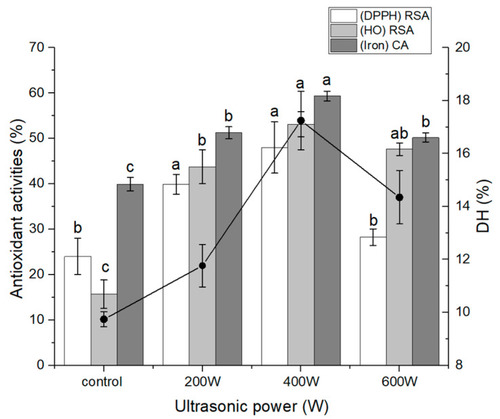
Effect of ultrasound pretreatment on the DH and antioxidant properties of oat protein hydrolysate. The different letters (a, b, c) represent significant differences in DH and activity among groups (p < 0.05).

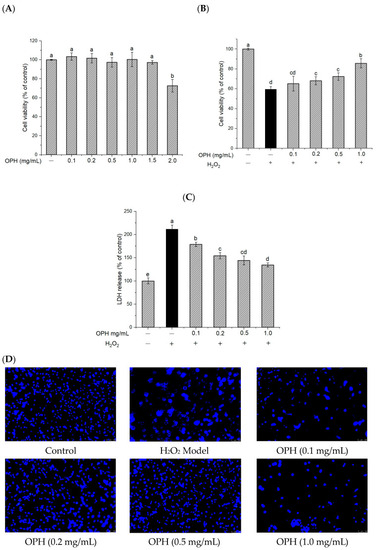
Effect of OPH on cell viability and LDH release in H2O2 -damaged PC12 cells. (A) sample cytotoxicity n = 3; (B) cell viability with sample and H2O2 n = 3; (C) LDH release, n = 3; (D) Hoechst 33,252 staining under an inverted microscope. Different letters (a, b, c, d, e) represent significant differences among groups (p < 0.05). (− and + in the graph represent the absence and presence of OPH or H2O2 in treatments).

Effect of OPH on the levels of ROS, CAT, GSH-px and SOD in PC12 cells. (A) Reactive oxygen species (ROS); (B) catalase (CAT) activity, n = 3; (C) glutathione (GSH-px), n = 3; (D) superoxide dismutase (SOD); n = 3. Different letters (a, b, c, d) represent significant differences among groups (p < 0.05). (− and + in the graph represent the absence and presence of OPH or H2O2 in treatments).

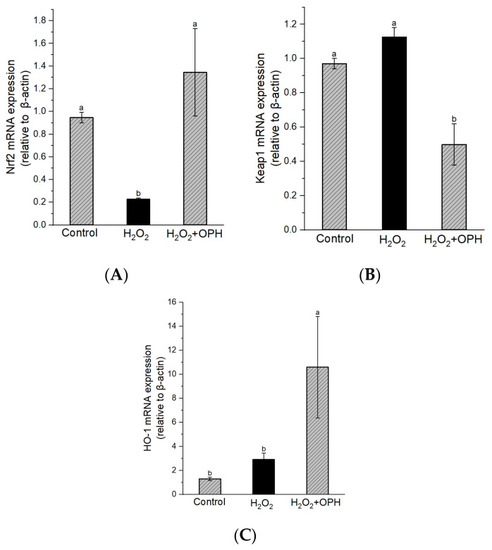
Effect of OPH on Nrf2/Keap1/HO-1 mRNA expression in H2O2-damaged PC12 cells. (A) Nrf2, (B) Keap1 and (C) HO-1 expression levels, n = 3. Different letters (a, b) represent the significant differences among groups (p < 0.05).

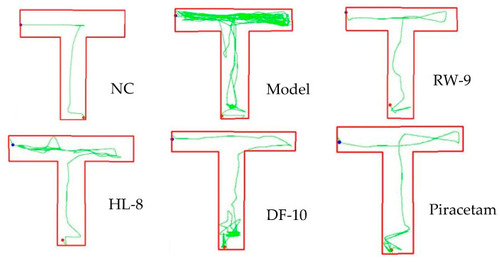
Behavior of zebrafish in T-maze testing.

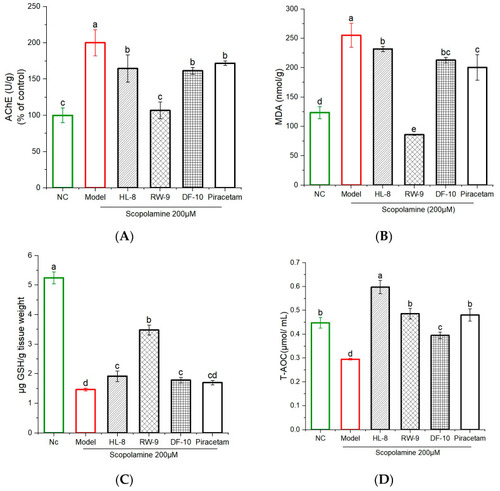
Effects of HL-8, RW-9, and DF-10 peptides on levels of acetylcholinesterase and oxidative stress in the brains of scopolamine-exposed zebrafish. (A) AChE, (B) MDA, (C) GSH, (D) T-AOC; n = 3. The data are presented as the mean ± S.D., and different letters (a, b, c, d, e) indicate significant differences among groups (p < 0.05).

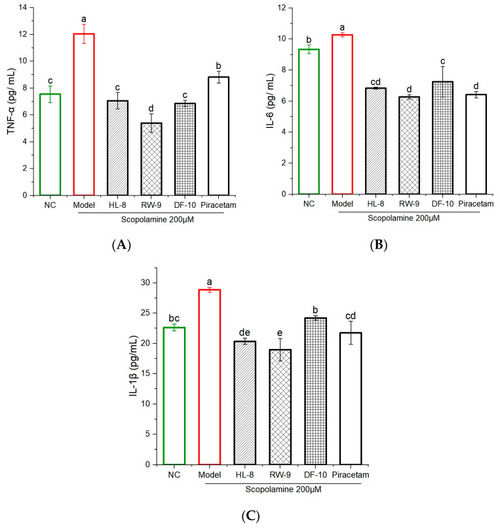
Effects of HL-8, RW-9, and DF-10 peptides on the inflammatory cytokines in the brains of Scopolamine-induced Zebrafish. (A) TNF-α, (B) IL-6, (C) IL-1β, n = 4. The data are presented mean ± S.D and different letters “a, b, c, d, e” among groups represents a significant difference (p < 0.05).

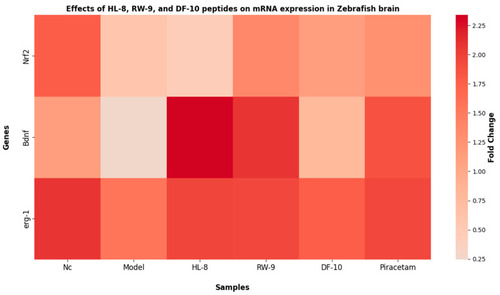
Effects of HL-8, RW-9, and DF-10 peptides on the Nrf2, Bdnf, and Erg1 gene expression zebrafish brains.

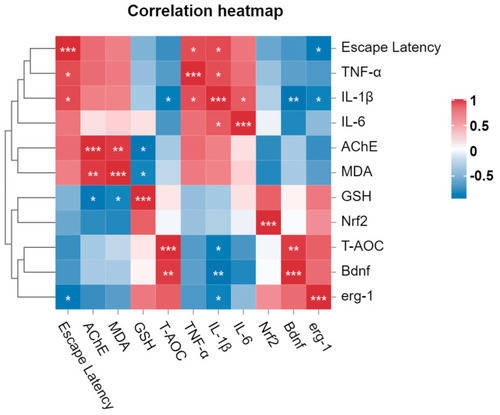
Correlation analysis of behavioral, genetic, and biochemical parameters. In the graph (*, **, and ***) represents the moderate, strong, and very strong correlation between different parameters, respectively.

Acknowledgments
This image is the copyrighted work of the attributed author or publisher, and ZFIN has permission only to display this image to its users. Additional permissions should be obtained from the applicable author or publisher of the image. Full text @ Nutrients