
Image
|
Figure Caption
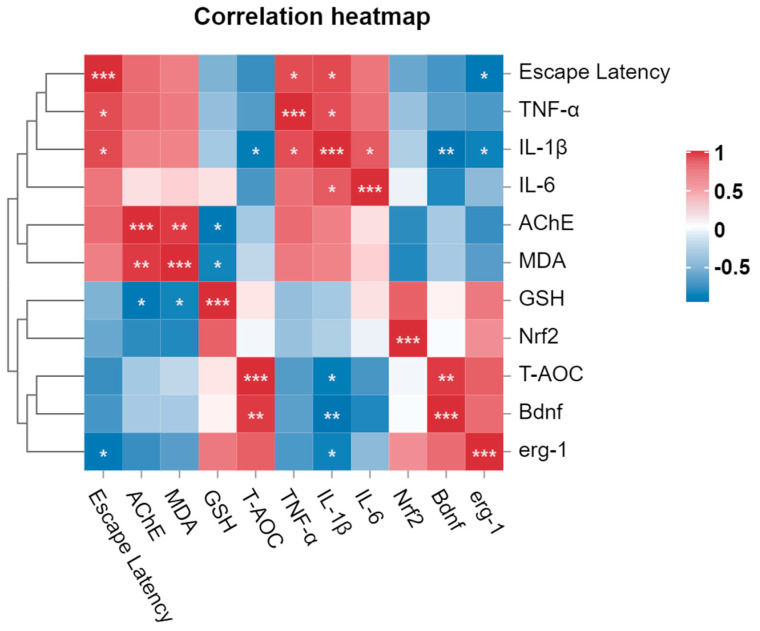
Figure 9
Correlation analysis of behavioral, genetic, and biochemical parameters. In the graph (*, **, and ***) represents the moderate, strong, and very strong correlation between different parameters, respectively.
Acknowledgments
This image is the copyrighted work of the attributed author or publisher, and
ZFIN has permission only to display this image to its users.
Additional permissions should be obtained from the applicable author or publisher of the image.
Full text @ Nutrients