
Image
|
Figure Caption
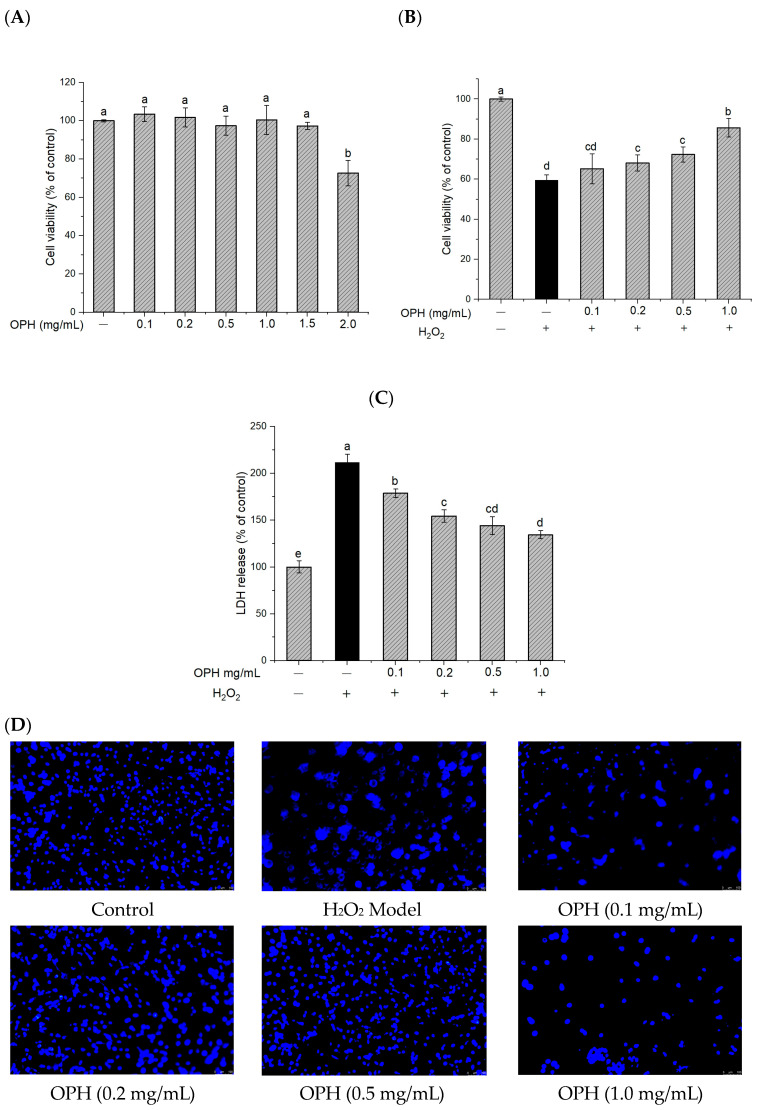
Figure 2
Effect of OPH on cell viability and LDH release in H2O2 -damaged PC12 cells. (
Acknowledgments
This image is the copyrighted work of the attributed author or publisher, and
ZFIN has permission only to display this image to its users.
Additional permissions should be obtained from the applicable author or publisher of the image.
Full text @ Nutrients