
- Title
-
Piezo1-dependent regulation of pericyte proliferation by blood flow during brain vascular development
- Authors
- Zi, H., Peng, X., Cao, J., Xie, T., Liu, T., Li, H., Bu, J., Du, J., Li, J.
- Source
- Full text @ Cell Rep.
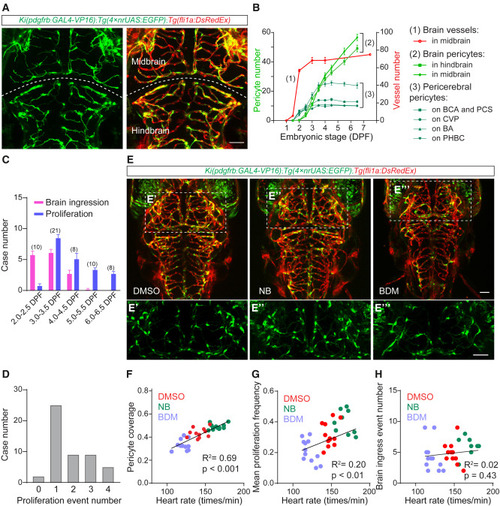
Blood flow promotes the proliferation of brain pericytes (A) Representative images of the pericytes and blood vessels in the brain of Ki(pdgfrb:GAL4-VP16);Tg(4×nrUAS:GFP);Tg(fli1a:DsRedEx) larvae at 4.5 DPF. EC is in red and pericyte in green. (B) Graph showing the numerical changes of the blood vessel segments in the midbrain, the pericytes in the brain, and the pericytes on the pericerebral vessels, including basal communicating artery (BCA), posterior communicating segment (PCS), choroidal vascular plexus (CVP), basilar artery (BA), and primordial hindbrain channel (PHBC). Zebrafish larvae during 1.5–6.5 DPF for pericyte number analysis and the larvae during 1.0–7.5 DPF for blood vessel number analysis in midbrain. N = 9 for pericytes, and n = 8 for midbrain vessel segments. (C) Graphic showing the event number of the ingress of pericerebral pericytes into the brain, and the brain pericyte proliferation occurred over a 12-h period each day during the early embryonic stage. (D) Graphic showing the number of the cases that a photoconverted single brain pericyte proliferated for varying times that occurred during 2.5–4.5 DPF, based on the images for brain pericyte fate tracking on Ki(pdgfrb:GAL4-VP16);Tg(UAS:Kaede) larvae as Figure S4D shows. (E) Representative images of the pericytes and blood vessels in the brain of the DMSO-, NB-, and BDM-treated Ki(pdgfrb:GAL4-VP16);Tg(4×nrUAS:GFP);Tg(fli1a:DsRedEx) larvae at 4.5 DPF. The images of pericytes in the midbrain are highlighted in (E′)–(E‴). EC is in red and pericyte in green. (F–H) Linear regression analysis for the effects of pharmacological modulations of blood flow on pericyte coverage of brain vessels (F), brain pericyte proliferation (G), and ingress of the pericerebral pericytes into the brain (H). Images are shown from a top view and partially z-projected. Scale bar, 50 μm for (A) and (E). Images of 4.5-DPF larvae are used for counting the number of brain pericytes and the pericyte coverage of brain vessels; time-lapse images of 3.0–3.5 DPF are used for counting the mean proliferation frequency of brain pericytes and the event number of ingress of pericerebral pericytes into the brain. Data are represented as mean ± SEM. The N values are shown above the bars in (C). See also Figures S1–S3. To study the dynamics of brain pericytes during cerebrovascular development, we carried out long-term serial confocal imaging of Ki(pdgfrb:GAL4-VP16);Tg(4×nrUAS:GFP);Tg(fli1a:DsRedEx) larvae during 1.5–6.5 days post-fertilization (DPF) (Figure S2A). We found that, at 1.5 DPF, no pericyte was present in the brain or on the pericerebral vessels, although the cerebral vessels had already begun forming (Figures 1B and S2A). Pericytes started to appear on pericerebral vessels at around 2.0 DPF and were initially observed in the brain at around 2.5 DPF (Figures 1B and S2A). After 2.5 DPF, the number of pericytes markedly increased in both the midbrain and hindbrain, and the brain vasculature was fully covered by pericytes at 6.5 DPF (Figures 1B and S2A). To determine how the number of pericytes increase in the brain, we performed in vivo time-lapse imaging with the interval of 2–4 h during 2.0–6.5 DPF. We found that pericytes on pericerebral vessels, including the basal communicating artery (BCA), choroidal vascular plexus (CVP), posterior communicating segment (PCS), and basilar artery (BA), migrated into the brain along perfused blood vessels (Figure S2B and Video S1). The ingress of pericerebral pericytes was the major contributor to the growth of brain pericyte population during 2.0–2.5 DPF (Figure 1C). After ingress into the brain, pericytes underwent proliferation to expand their population (Figures 1C and S2C and Video S2), while the proliferation of pericytes in the brain took a dominant role after 3.0–3.5 DPF, and the ingress of pericerebral pericytes into the brain could hardly be observed after 5.0 DPF (Figure 1C). Therefore, brain pericytes expand their population mainly through proliferation after ingress into the brain during development. |
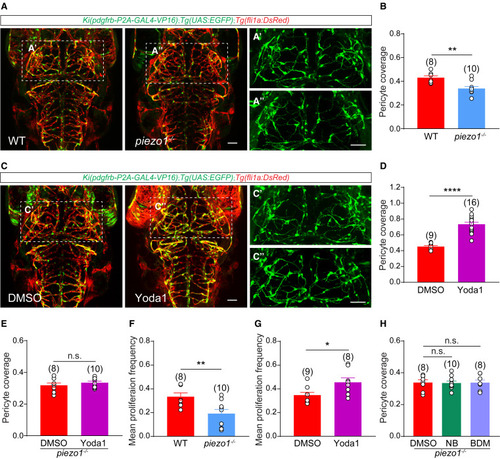
Piezo1 is required for blood flow regulation of pericyte proliferation (A) Representative images of pericytes and blood vessels in the brain of the wild-type (WT) and piezo1 knockout (piezo1−/−) larvae with Ki(pdgfrb:GAL4-VP16);Tg(4×nrUAS:GFP);Tg(fli1a:DsRedEx) background at 4.5 DPF. The images of pericytes in the midbrain are highlighted in (A′) and (A″). EC is in red and pericyte in green. (B) Effect of piezo1 knockout on pericyte coverage of brain vessels. (C) Representative images of pericytes and blood vessels in the brain of control (DMSO) and Piezo1 activator (Yoda1)-treated Ki(pdgfrb:GAL4-VP16);Tg(4×nrUAS:GFP);Tg(fli1a:DsRedEx) larvae at 4.5 DPF. The images of pericytes in the midbrain are highlighted in (C′) and (C″). EC is in red and pericyte in green. (D) Effect of Yoda1 treatment on pericyte coverage of brain vessels. All experiments were independent for DMSO controls. (E) Effect of Yoda1 treatment on the pericyte coverage of brain vessels in piezo1−/− larvae. (F) Effect of piezo1 knockout on brain pericyte proliferation. (G) Effect of Yoda1 treatment on brain pericyte proliferation. All experiments were independent for DMSO controls. (H) Effects of NB and BDM treatment on pericyte coverage of brain vessels in Ki(pdgfrb:GAL4-VP16);Tg(4×nrUAS:GFP);Tg(fli1a:DsRedEx);piezo1−/− larvae. Images are shown from a top view and partially z-projected. Scale bar, 50 μm for (A) and (C). Images of 4.5-DPF larvae are used for counting the brain pericyte number and the pericyte coverage on brain vessels, images of 3.5-DPF larvae are used for counting the percentage of brain pericytes in G2/M/S phase, and time-lapse images during 3.0–3.5 DPF are used for counting the mean proliferation frequency of brain pericytes. Data are represented as mean ± SEM. The N values are shown above the aligned plots. Stars represent the results of unpaired two-tailed Student’s t test between groups (∗p < 0.05, ∗∗p < 0.01, ∗∗∗∗p < 0.0001). See also Figure S4. |
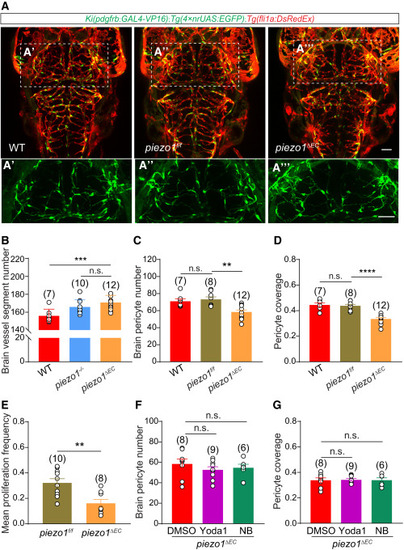
EC-specific Piezo1 mediates the blood flow effect on pericyte proliferation (A) Representative images of the pericytes and blood vessels in the midbrain of WT, piezo1f/f, and piezo1ΔEC larvae with Ki(pdgfrb:GAL4-VP16);Tg(4×nrUAS:GFP);Tg(fli1a:DsRedEx) background at 4.5 DPF. The images of pericytes in the midbrain are highlighted in (A′)–(A‴). EC is in red and pericyte in green. (B) Brain vessel segment numbers in WT, piezo1−/−, and piezo1ΔE larvae. The data of Figure S4A are replotted here for piezo1−/− group. (C) Effect of EC-specific piezo1 knockout on brain pericyte number. (D) Effect of EC-specific piezo1 knockout on pericyte coverage of brain vessels. (E) Effect of EC-specific piezo1 knockout on brain pericyte proliferation, compared with the sibling piezo1f/f larvae. (F and G) Effects of Yoda1 and NB treatment on brain pericyte number (F) and pericyte coverage of brain vessels (G) in Ki(pdgfrb:GAL4-VP16);Tg(4×nrUAS:GFP);Tg(fli1a:DsRedEx);piezo1ΔEC larvae. Images are shown from a top view and partially z-projected. Scale bar, 50 μm for (A) and (A′–A‴). Images of 4.5-DPF larvae are used for counting the brain pericyte number and the pericyte coverage of brain vessels, and time-lapse images during 3.0–3.5 DPF are used for counting the mean proliferation frequency of brain pericytes. Data are represented as mean ± SEM. The N values are shown above the aligned plots. Stars represent the results of unpaired two-tailed Student’s t test between groups (∗∗p < 0.01, ∗∗∗p < 0.001, ∗∗∗∗p < 0.0001). See also Figure S5. |

Notch signaling mediates the regulation of pericyte proliferation by blood flow and Piezo1 (A) Representative images of the d2GFP-labeled ECs with Notch activation in the brain of Yoda1-treated Tg(fli1a:DsRedEx);Tg(Tp1:d2GFP) larvae at 4.5 DPF, compared to the location-matched ECs in the DMSO control larvae. EC is in red, and cell of high Notch activation is in green. (B) Effects of Yoda1 treatment and piezo1 knockout on Notch signaling in brain ECs. TP1+ brain EC number denotes the total number of TP1+ ECs in the entire brain. (C) Representative images of the pericytes and blood vessels in the midbrain of DMSO-, DAPT-, DAPT+NB-, and DAPT+Yoda1-treated Ki(pdgfrb:GAL4-VP16);Tg(4×nrUAS:GFP);Tg(fli1a:DsRedEx) larvae at 4.5 DPF. EC is in red and pericyte in green. All experiments were independent for DMSO controls. (D) Effects of DAPT, DAPT+NB, and DAPT+Yoda1 treatment on midbrain pericyte number. All experiments illustrated were independent for DMSO controls. (E) Effects of DAPT, DAPT+NB, and DAPT+Yoda1 treatment on pericyte coverage of midbrain vessels. All experiments were independent for DMSO controls. (F) Effect of DAPT treatment on brain pericyte proliferation. All experiments were independent for DMSO controls. Images are shown from a top view and partially z-projected. Scale bar, 50 μm for (A) and (C). Images of 4.5-DPF larvae are used for counting the number of pericytes and the pericyte coverage of the vessels in the midbrain, and time-lapse images during 3.0–3.5 DPF are used for counting the mean proliferation frequency of brain pericytes. Data are represented as mean ± SEM. The N values are shown above the aligned plots. Stars represent the results of unpaired two-tailed Student’s t test between groups (∗p < 0.05, ∗∗p < 0.01, ∗∗∗p < 0.001). See also Figure S6. |
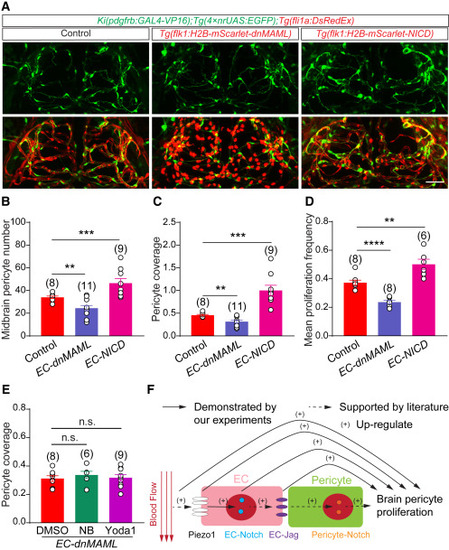
EC-intrinsic Notch signaling functions downstream of the blood flow-Piezo1 axis (A) Representative images of the pericytes and blood vessels in the midbrain of control, Tg(kdrl:H2B-mScarlet-P2A-dnMAML), and Tg(kdrl:H2B-mScarlet-P2A-NICD) larvae with Ki(pdgfrb:GAL4-VP16);Tg(4×nrUAS:GFP);Tg(fli1a:DsRedEx) background at 4.5 DPF. EC and the nucleus of dnMAML/NICD -expressing cell is in red and pericyte in green. (B–D) Effects of EC-specific dnMAML/NICD overexpression on midbrain pericyte number (B), pericyte coverage of midbrain vessels (C), and brain pericyte proliferation (D). All experiments were independent for DMSO controls in (B–D). (E) Effects of DMSO, NB, and Yoda1 treatment on pericyte coverage of midbrain vessels in Ki(pdgfrb:GAL4-VP16);Tg(4×nrUAS:GFP);Tg(fli1a:DsRedEx);Tg(kdrl:H2B-mNeoGreen-P2A-dnMAML) larvae. (F) Graphical summary of our work. Blood flow activates Piezo1 in ECs, which in turn activates EC-intrinsic Notch signaling. Then, Notch activation in ECs might lead to autonomous expression of Notch ligands, which in turn activates Notch signaling in pericytes and promotes brain pericyte proliferation. The arrows with a solid line are demonstrated by our experiments, and the arrows with a dashed line are supported by the literature and inference. Images are shown from a top view and partially z-projected in (A). Scale bar, 50 μm for (A). Images of 4.5-DPF larvae are used for counting the number of pericytes and the pericyte coverage of vessels in the midbrain, and time-lapse images during 3.0–3.5 DPF are used for counting the proliferation frequency of brain pericytes. Data are represented as mean ± SEM. The N values are shown above the aligned plots. Stars represent the results of unpaired two-tailed Student’s t test between groups (∗∗p < 0.01, ∗∗∗p < 0.001, ∗∗∗∗p < 0.0001). See also Figures S6 and S7. |