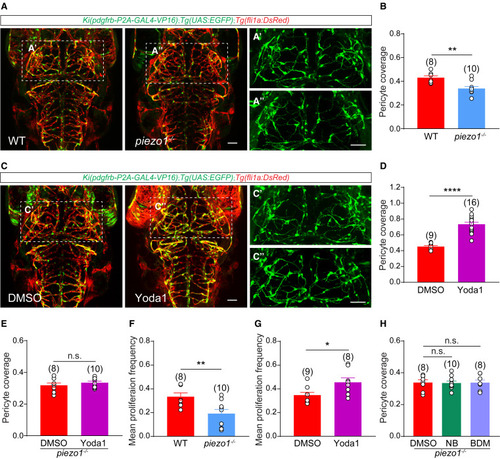
Piezo1 is required for blood flow regulation of pericyte proliferation (A) Representative images of pericytes and blood vessels in the brain of the wild-type (WT) and piezo1 knockout (piezo1−/−) larvae with Ki(pdgfrb:GAL4-VP16);Tg(4×nrUAS:GFP);Tg(fli1a:DsRedEx) background at 4.5 DPF. The images of pericytes in the midbrain are highlighted in (A′) and (A″). EC is in red and pericyte in green. (B) Effect of piezo1 knockout on pericyte coverage of brain vessels. (C) Representative images of pericytes and blood vessels in the brain of control (DMSO) and Piezo1 activator (Yoda1)-treated Ki(pdgfrb:GAL4-VP16);Tg(4×nrUAS:GFP);Tg(fli1a:DsRedEx) larvae at 4.5 DPF. The images of pericytes in the midbrain are highlighted in (C′) and (C″). EC is in red and pericyte in green. (D) Effect of Yoda1 treatment on pericyte coverage of brain vessels. All experiments were independent for DMSO controls. (E) Effect of Yoda1 treatment on the pericyte coverage of brain vessels in piezo1−/− larvae. (F) Effect of piezo1 knockout on brain pericyte proliferation. (G) Effect of Yoda1 treatment on brain pericyte proliferation. All experiments were independent for DMSO controls. (H) Effects of NB and BDM treatment on pericyte coverage of brain vessels in Ki(pdgfrb:GAL4-VP16);Tg(4×nrUAS:GFP);Tg(fli1a:DsRedEx);piezo1−/− larvae. Images are shown from a top view and partially z-projected. Scale bar, 50 μm for (A) and (C). Images of 4.5-DPF larvae are used for counting the brain pericyte number and the pericyte coverage on brain vessels, images of 3.5-DPF larvae are used for counting the percentage of brain pericytes in G2/M/S phase, and time-lapse images during 3.0–3.5 DPF are used for counting the mean proliferation frequency of brain pericytes. Data are represented as mean ± SEM. The N values are shown above the aligned plots. Stars represent the results of unpaired two-tailed Student’s t test between groups (∗p < 0.05, ∗∗p < 0.01, ∗∗∗∗p < 0.0001). See also Figure S4.
|
