FIGURE SUMMARY
Title

Multiple gene-drug prediction tool reveals Rosiglitazone based treatment pathway for non-segmental vitiligo

Authors
Zhao, S., Chen, X., Dutta, K., Chen, J., Wang, J., Zhang, Q., Jia, H., Sun, J., Lai, Y.
Source
Full text @ Inflammation

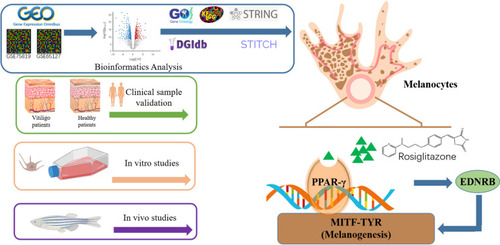
Summary of the effects of rosiglitazone on vitiligo.

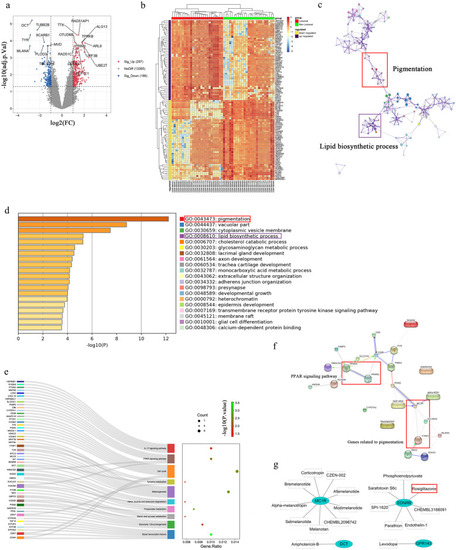
Differentially expressed genes (DEGs) between the vitiligo lesional skin group and non-lesional skin group among GEO-datasets. a Volcano plot of DEGs among GSE75819 and GSE65127 datasets. The red and blue spots represented relative upregulated and downregulated DEGs based on |fold change| > 1 and adjusted p-value < 0.05. b Cluster heatmap of the top 100 DEGs sorted by log fold change. c Network of GO term enrichment analysis (red frame are pigmentation-related genes; purple frame are lipid biosynthetic process–related genes). d GO terms enrichment analysis of DEGs is presented (each band representing an enriched term or pathway, colored according to a −log10 p-value). e Kyoto Encyclopedia of Genes and Genomes (KEGG) pathway enrichment by analysis of all differentially expressed genes (DEGs) (10 potentially vitiligo-relevant pathways and related genes). f Protein–protein interaction (PPI) network between PPAR signing pathway and pigmentation. G Gene-drug prediction of potential compounds.

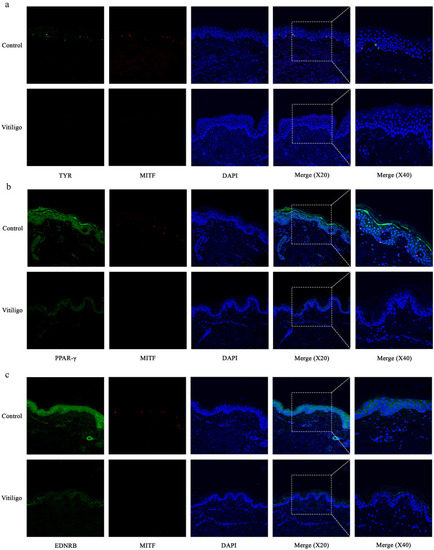
Melanocyte deficiency in vitiligo lesions is accompanied by impaired expression of PPAR-γ and EDNRB. a Representative images of the melanocytes in healthy skin samples (n = 5) and vitiligo lesions (n = 5) detected by immunofluorescence. Melanocytes were stained with antibodies to TYR (green) and MITF (red). Nuclei were counterstained with DAPI (blue). b Representative images of the expression of PPAR-γ (green) in healthy skin (n = 5) and vitiligo lesions (n = 5) detected using immunofluorescence. Melanocytes were stained with antibodies to MITF (red). Nuclei were counterstained with DAPI (blue). c Representative images of the expression of EDNRB (green) in healthy skin (n = 5) and vitiligo lesions (n = 5) detected using immunofluorescence. Melanocytes were stained with antibodies to MITF (red). Nuclei were counterstained with DAPI (blue).

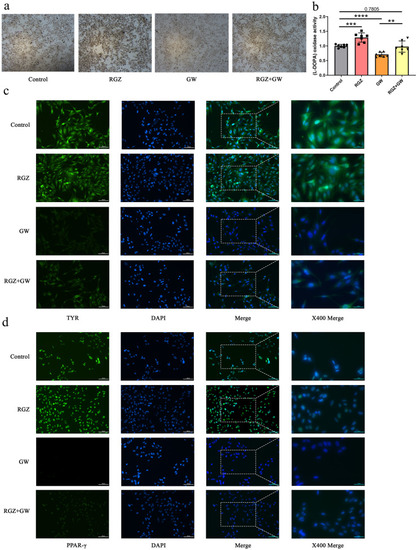
Effect of PPAR-γ signaling pathway on melanogenesis. aL-dopa staining of melanoma cells (Mum-2C) treated with rosiglitazone and GW9662 for 48 h. b Quantification of melanogenesis by L-dopa staining. c Immunofluorescence of TYR in melanoma cells for 48 h. d Immunofluorescence of PPAR-γ in melanoma cells for 48 h. Data represent mean ± 95% confidence interval (CI) ***p < 0.001; ****p < 0.0001; n = 7.

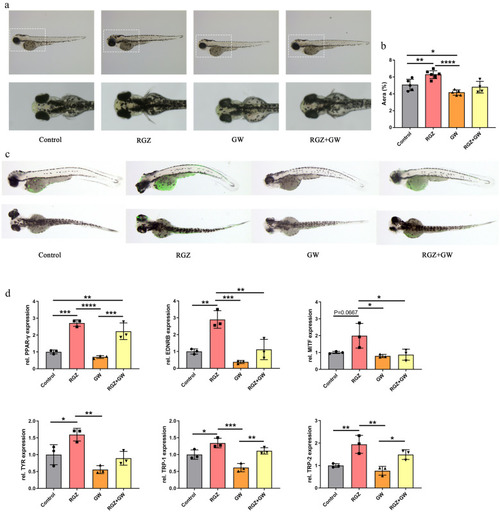
PAPR-γ pathway activation increases melanogenesis in zebrafish. a Melanin granules in the head of zebrafish and melanin granules of zebrafish at 72 hpf. b The area of melanin granules as a percentage of the head area was measured by ImageJ at 72 hpf. c Immunofluorescence analysis of zebrafish at 72 hpf after rosiglitazone and GW9662 treatment. d The expression of ppar-γ, ednrb, mitf, tyr, trp-1, and trp-2 in zebrafish at 72 hpf. Data represent mean ± 95% confidence interval (CI); *p < 0.05; **p < 0.01; ***p < 0.001; n > 3.

Acknowledgments
This image is the copyrighted work of the attributed author or publisher, and ZFIN has permission only to display this image to its users. Additional permissions should be obtained from the applicable author or publisher of the image. Full text @ Inflammation