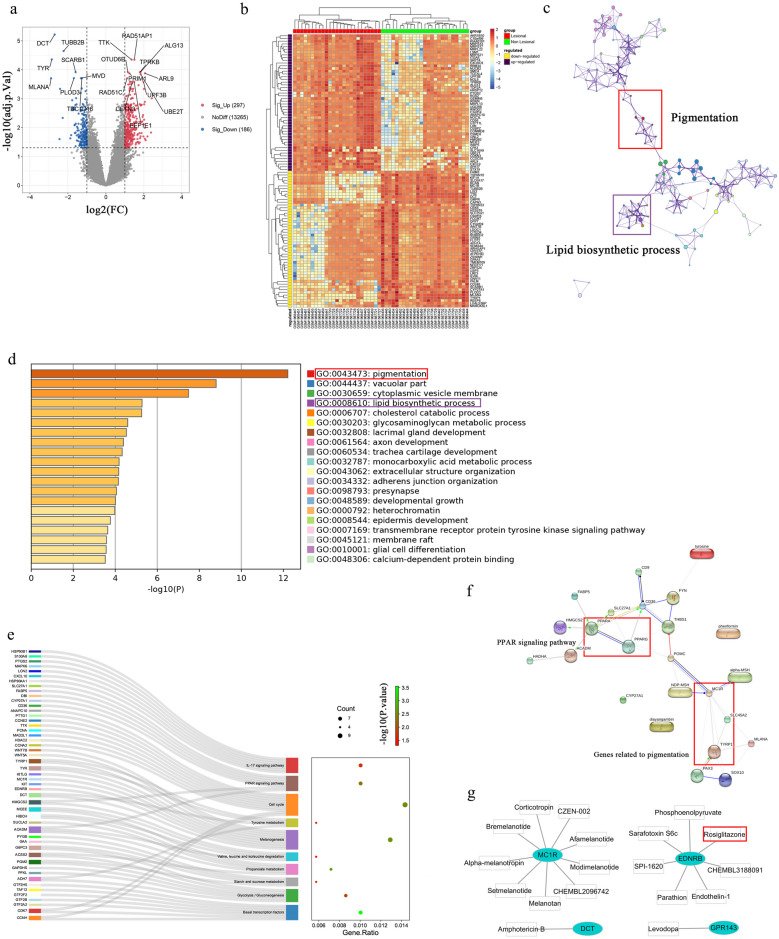
IMAGE

Fig. 2

ID
ZDB-IMAGE-240508-38
Source
Figures for Zhao et al., 2023
Image
Figure Caption

Fig. 2

Differentially expressed genes (DEGs) between the vitiligo lesional skin group and non-lesional skin group among GEO-datasets. a Volcano plot of DEGs among GSE75819 and GSE65127 datasets. The red and blue spots represented relative upregulated and downregulated DEGs based on |fold change| > 1 and adjusted p-value < 0.05. b Cluster heatmap of the top 100 DEGs sorted by log fold change. c Network of GO term enrichment analysis (red frame are pigmentation-related genes; purple frame are lipid biosynthetic process–related genes). d GO terms enrichment analysis of DEGs is presented (each band representing an enriched term or pathway, colored according to a −log10 p-value). e Kyoto Encyclopedia of Genes and Genomes (KEGG) pathway enrichment by analysis of all differentially expressed genes (DEGs) (10 potentially vitiligo-relevant pathways and related genes). f Protein–protein interaction (PPI) network between PPAR signing pathway and pigmentation. G Gene-drug prediction of potential compounds.

Acknowledgments
This image is the copyrighted work of the attributed author or publisher, and ZFIN has permission only to display this image to its users. Additional permissions should be obtained from the applicable author or publisher of the image. Full text @ Inflammation