FIGURE SUMMARY
Title

Optimal tagging strategies for illuminating expression profiles of genes with different abundance in zebrafish

Authors
Liu, J., Li, W., Jin, X., Lin, F., Han, J., Zhang, Y.
Source
Full text @ Commun Biol

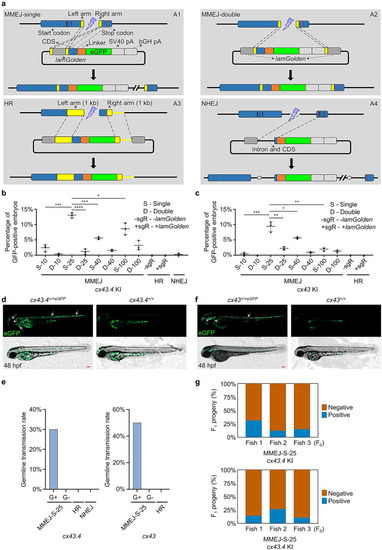
S-25 donor ensures efficient MMEJ-mediated KI in zebrafish.

a Schematic diagrams of MMEJ-, HR-, and NHEJ-mediated KI strategies, respectively. MMEJ-based donor vector containing a single artificial consensus Cas9/sgRNA binding site (lamGolden) was called MMEJ-single (A1), while the one with two lamGolden sites was named MMEJ-double (A2). One-kb homologous arms were used in the design for HR-based donors (A3). The NHEJ-based donor was shown in A4. Exons, lamGolden sites, linkers, eGFP, and SV40+bGH polyA are colored blue, gray, orange, green, and blank, respectively. Introns are shown as black lines. Homologous arms are shown in yellow. Start and stop codons are labeled as green and red vertical lines, respectively. b, c Percentages of GFP-positive embryos for cx43.4 and cx43 KI, respectively. Each donor was co-microinjected into wild-type (WT) zebrafish embryos at the one-cell stage with the Cas9/sgRNA system. GFP-positive embryos were counted at 48 h post fertilization (hpf). Donors are as follows: S-10, S-25, S-40, and S-100 donors are MMEJ-single with 10-bp, 25-bp, 40-bp, and 100-bp homologous arms, respectively; D-10, D-25, D-40, and D-100 donors are MMEJ-double with 10-bp, 25-bp, 40-bp, and 100-bp homologous arms, respectively; +sgR, microinjection with lamGolden sgRNA; -sgR, microinjection without lamGolden sgRNA. At least 100 embryos were analyzed for each group in one experiment. Data represent mean ± SD of 3 independent experiments. P-values were calculated using an unpaired Student’s t-test. *P < 0.05; **P < 0.01; ***P < 0.001; ****P < 0.0001. d, f Images of F1 zebrafish carrying KI alleles in cx43.4 or cx43 loci. White arrowheads indicate GFP signals in the notochord, spinal cord, cerebral cortex, cornea, and hatching gland of a cx43.4+/+eGFP larva at 48 hpf (d) and in the notochord, spinal cord, lens capsule, and ultimobranchial body of a cx43+/+eGFP larva at 48 hpf (f). Scale bars, 100 µm. Images are representatives of at least 10 larvae. e Germline transmission rates of GFP-tagged cx43.4 or cx43 using different strategies. “G+” represents GFP-positive F0 zebrafish, and “G−” represents GFP-negative F0 zebrafish. At least 6 F0 were analyzed for each group. g Mosaicism of the germline of F0 founders was determined by the percentage of F1 carrying the KI cassette. GFP-positive cx43.4+/+eGFP or cx43+/+eGFP F1 were in blue, and GFP-negative cx43.4+/+ or cx43+/+ F1 were in orange. More than 100 F1 were examined for each F0 founder.

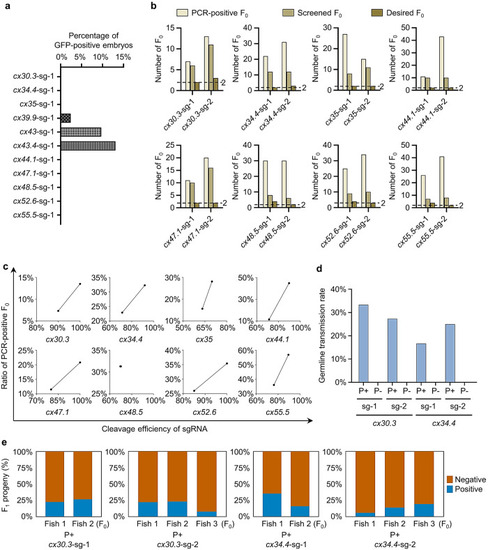
Evaluation of the S-25 strategy by tagging all zebrafish connexins.

a Percentages of GFP-positive F0 embryos after tagging cx30.3, cx34.4, cx35, cx39.9, cx43, cx43.4, cx44.1, cx47.1, cx48.5, cx52.6, or cx55.5. S-25 strategy was performed and GFP-positive F0 embryos were counted at 48 hpf. At least 200 embryos were analyzed for each gene. b Number of the desired F0 for cx30.3, cx34.4, cx35, cx44.1, cx47.1, cx48.5, cx52.6, or cx55.5 KI. Genomic DNAs were extracted from the caudal fins of 96 injected F0 zebrafish (except for cx55.5, the genomic DNAs of which were from 72 F0 zebrafish) and used for 5’-junction PCR. PCR-positive F0 are those positive for 5’-junction PCR. Screened F0 are the PCR-positive F0 outbred with WT zebrafish. Desired F0 are the screened F0 whose F1 offspring had precisely repaired 5’-junction. Two high-efficiency sgRNAs were chosen for each gene KI (sg-1 and sg-2). c Correlation between the cleavage efficiencies of sgRNAs and the ratios of PCR-positive F0. The cleavage efficiency of a sgRNA was evaluated by PCR product enzymatic digestions at 24-h post injection or software analysis by the TIDE website. d Germline transmission rates of PCR-positive F0 and PCR-negative F0 for cx30.3 and cx34.4 KI. “P+”, PCR-positive F0; “P-”, PCR-negative F0. Two high-efficiency sgRNAs were used for KI at either locus. At least 6 F0 were analyzed for each group. e Mosaicism of the germline of F0 founders for cx30.3 and cx34.4 KI was determined by the percentage of F1 carrying the KI cassette. PCR-positive cx30.3+/+eGFP or cx34.4+/+eGFP F1 were shown in blue and PCR-negative cx30.3+/+ or cx34.4+/+ F1 were in orange. More than 70 F1 were examined for each PCR-positive F0 founder.

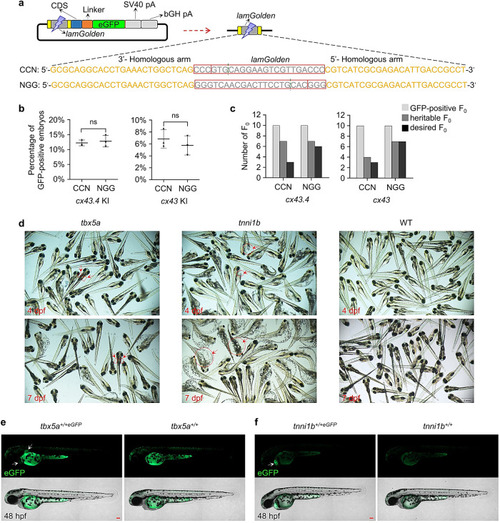
Reducing non-homologous residues introduced by lamGolden sequence increases the accuracy of MMEJ-mediated KI.

a A schematic diagram of S-NGG-25 and S-CCN-25 donors for cx43.4 KI. Sense or antisense lamGolden site is represented by “NGG” or “CCN”. Predicted cleavage sites of Cas9 were indicated by green dotted lines, and residuals left in homologous arms were shown in gray. b Percentages of GFP-positive embryos obtained by using S-CCN-25 or S-NGG-25 strategy for cx43.4 or cx43 KI. GFP-positive embryos were counted at 48 hpf. At least 100 embryos were analyzed for each strategy for each gene. Data represent mean ± SD of 3 independent experiments. P-values were calculated using an unpaired Student’s t-test. ns, not significant. c Numbers of desired F0 obtained using S-CCN-25 or S-NGG-25 strategy. Heritable F0 are the GFP-positive F0 whose KI alleles can be detected in their F1. Desired F0 are the GFP-positive F0 whose KI alleles were verified in their F1 to be heritable and precise by 5’-junction PCR. d Images of F0 embryos after tbx5a or tnni1b KI. Cas9 mRNA, sgRNA (targeting tbx5a or tnni1b), and the corresponding S-NGG-25 donor were co-injected into WT one-cell-stage embryos; images were taken at 4 and 7 days post fertilization (dpf). Deficient embryos were indicated by red arrowheads. WT embryos were used as the control. Scale bars, 1 mm. e, f Images of tbx5a+/+eGFP and tnni1b+/+eGFP F1. White arrowheads indicate GFP signals in the heart and pectoral fin of a tbx5a+/+eGFP larva at 48 hpf (e) and in the heart of a tnni1b+/+eGFP larva at 48 hpf (f). Scale bars, 100 µm. Images are representatives of at least 10 larvae.

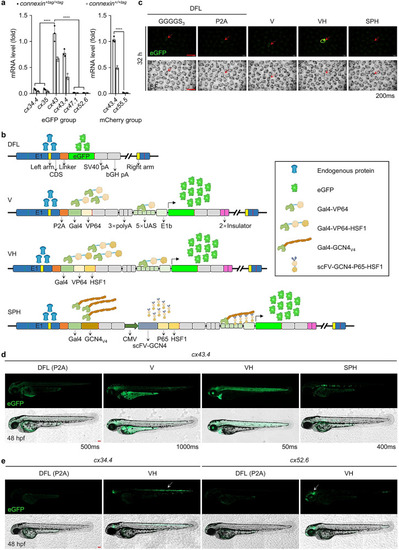
Fluorescent signals can be dramatically amplified by the VH strategy.

a mRNA levels of fluorescence-labeled connexins in F3 zebrafish. Thirty connexin+tag/+tag or connexin+/+tag zebrafish larvae were pooled to extract RNA for qPCR. qPCR primers were designed to target the fluorescence tag. For the group with eGFP-labeling, data were normalized to actb1 and relative to cx43+eGFP/+eGFP. For the mCherry group, data were normalized to actb1 and relative to cx43.4+mCherry/+mCherry. Data are presented as mean ± SD of 3 independent experiments. Three repeats were included per group. P-values were calculated using an unpaired Student’s t-test. ****P < 0.0001. b Schematic diagrams of the genome after editing by direct fluorescence-labeling (DFL), V, VH, and SPH strategies, respectively. All strategies are built on the S-NGG-25 KI method. Theoretically, for the DFL strategy, eGFP is directly linked to the target gene by a P2A linker or a GSSSS3-linker and would be co-expressed with the target gene. For the V or VH strategy, Gal4-VP64 or Gal4-VP64-HSF1 would be co-expressed with the target gene, be separated from the target protein due to the function of a P2A peptide, and then induce eGFP expression by binding 5×nrUAS. For the SPH strategy, Gal4-GCN4 would be co-expressed with the target gene, be separated from the target protein, and then work together with scFV-GCN4-P65-HSF1, which is constitutively expressed in all cells, to transcriptionally activate expression of eGFP. c Fluorescence images of F1 embryos carrying fluorescence-labeled alleles generated by using DFL, V, VH, or SPH strategy at the cx43.4 loci at 32 hpf. Desired F1 were screened out based on GFP expression patterns and genotyping results. Images were representatives of at least 10 desired F1 and were captured under the same exposure time (200 ms). Scale bars, 2 mm. d GFP expression patterns in F1 larvae generated by DFL, V, VH, or SPH strategy at the cx43.4 locus. GFP was detected in the entire notochord of F1 generated by DFL or VH but was only partially in the notochord of F1 generated by V or SPH at 48 hpf. Exposure time was determined by the fluorescence intensity of GFP signals. Scale bars, 100 µm. Images are representatives of at least 10 F1 larvae. e Images of F1 larvae for cx34.4 or cx52.6 KI generated by a DFL strategy using a P2A linker or a VH strategy. GFP signals were detected in the spinal cord and hindbrain at 48 hpf in cx34.4+/+VH embryos and in the forebrain, midbrain, and posterior notochord at 48 hpf in cx52.6+/+VH embryos. Scale bars, 100 µm. Images are representatives of at least 10 F1 larvae.

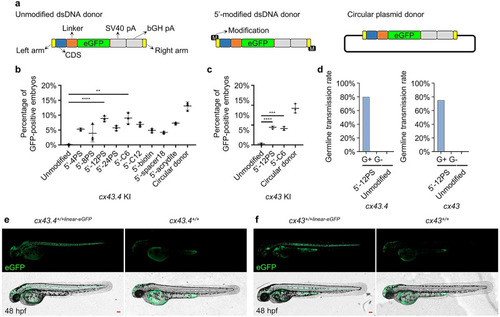
Establishment of 5’-end-modified dsDNA mediated KI system based on S-NGG-25 KI strategy.

a A schematic diagram of unmodified linearized dsDNA, 5’-modified linearized dsDNA, and circular dsDNA donors. All of the donors have the same integration cassette, including two homologous arms, a CDS, a linker, an eGFP coding sequence, and two polyA signals. 5’-modifications were added to the 5’-terminus of the linearized dsDNAs by using modified PCR primers. b, c Percentages of GFP-positive embryos after 1-cell-stage microinjection of Cas9/sgRNA together with different 5’-modified linearized dsDNA, unmodified linearized dsDNA, or circular dsDNA donors. cx43.4 and cx43 loci were chosen to evaluate modifications including PS, C6, C12, biotin, spacer18, and acrydite. GFP-positive embryos were counted at 48 hpf. At least 100 embryos were analyzed for each condition. Data represent mean ± SD of 3 independent experiments. P-values were calculated using an unpaired Student’s t-test. **P < 0.01; ***P < 0.001; ****P < 0.0001. d Germline transmission rates of tagged cx43.4 or cx43 using the 12PS-modified linearized donors. “G+” represents GFP-positive F0, and “G−” represents GFP-negative F0. At least 4 GFP-positive or 20 GFP-negative F0 embryos were raised to adulthood and outbred with WT zebrafish. The number of F0 that can generate the desired F1 was counted to calculate the germline transmission rate. e, f Images of cx43.4+/+linear-eGFP (e) and cx43+/+linear-eGFP (f) F1 embryos derived from outbreeding the desired F0. Images were taken at 48 hpf. Scale bars, 100 µm. Images are representatives of at least 10 GFP-positive F1 embryos.

Acknowledgments
This image is the copyrighted work of the attributed author or publisher, and ZFIN has permission only to display this image to its users. Additional permissions should be obtained from the applicable author or publisher of the image. Full text @ Commun Biol