IMAGE

Fig. 4

ID
ZDB-IMAGE-231225-22
Source
Figures for Liu et al., 2023
Image
Figure Caption

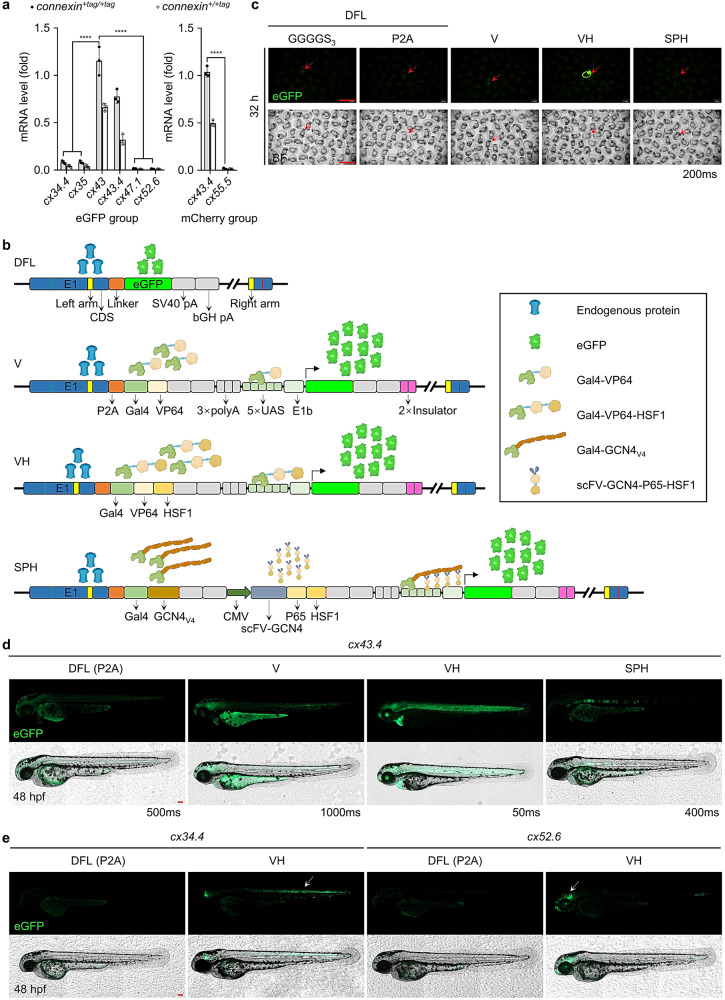
Fig. 4 Fluorescent signals can be dramatically amplified by the VH strategy.

a mRNA levels of fluorescence-labeled connexins in F3 zebrafish. Thirty connexin+tag/+tag or connexin+/+tag zebrafish larvae were pooled to extract RNA for qPCR. qPCR primers were designed to target the fluorescence tag. For the group with eGFP-labeling, data were normalized to actb1 and relative to cx43+eGFP/+eGFP. For the mCherry group, data were normalized to actb1 and relative to cx43.4+mCherry/+mCherry. Data are presented as mean ± SD of 3 independent experiments. Three repeats were included per group. P-values were calculated using an unpaired Student’s t-test. ****P < 0.0001. b Schematic diagrams of the genome after editing by direct fluorescence-labeling (DFL), V, VH, and SPH strategies, respectively. All strategies are built on the S-NGG-25 KI method. Theoretically, for the DFL strategy, eGFP is directly linked to the target gene by a P2A linker or a GSSSS3-linker and would be co-expressed with the target gene. For the V or VH strategy, Gal4-VP64 or Gal4-VP64-HSF1 would be co-expressed with the target gene, be separated from the target protein due to the function of a P2A peptide, and then induce eGFP expression by binding 5×nrUAS. For the SPH strategy, Gal4-GCN4 would be co-expressed with the target gene, be separated from the target protein, and then work together with scFV-GCN4-P65-HSF1, which is constitutively expressed in all cells, to transcriptionally activate expression of eGFP. c Fluorescence images of F1 embryos carrying fluorescence-labeled alleles generated by using DFL, V, VH, or SPH strategy at the cx43.4 loci at 32 hpf. Desired F1 were screened out based on GFP expression patterns and genotyping results. Images were representatives of at least 10 desired F1 and were captured under the same exposure time (200 ms). Scale bars, 2 mm. d GFP expression patterns in F1 larvae generated by DFL, V, VH, or SPH strategy at the cx43.4 locus. GFP was detected in the entire notochord of F1 generated by DFL or VH but was only partially in the notochord of F1 generated by V or SPH at 48 hpf. Exposure time was determined by the fluorescence intensity of GFP signals. Scale bars, 100 µm. Images are representatives of at least 10 F1 larvae. e Images of F1 larvae for cx34.4 or cx52.6 KI generated by a DFL strategy using a P2A linker or a VH strategy. GFP signals were detected in the spinal cord and hindbrain at 48 hpf in cx34.4+/+VH embryos and in the forebrain, midbrain, and posterior notochord at 48 hpf in cx52.6+/+VH embryos. Scale bars, 100 µm. Images are representatives of at least 10 F1 larvae.

Acknowledgments
This image is the copyrighted work of the attributed author or publisher, and ZFIN has permission only to display this image to its users. Additional permissions should be obtained from the applicable author or publisher of the image. Full text @ Commun Biol