
- Title
-
ROS-induced ribosome impairment underlies ZAKα-mediated metabolic decline in obesity and aging
- Authors
- Snieckute, G., Ryder, L., Vind, A.C., Wu, Z., Arendrup, F.S., Stoneley, M., Chamois, S., Martinez-Val, A., Leleu, M., Dreos, R., Russell, A., Gay, D.M., Genzor, A.V., Choi, B.S., Basse, A.L., Sass, F., Dall, M., Dollet, L.C.M., Blasius, M., Willis, A.E., Lund, A.H., Treebak, J.T., Olsen, J.V., Poulsen, S.S., Pownall, M.E., Jensen, B.A.H., Clemmensen, C., Gerhart-Hines, Z., Gatfield, D., Bekker-Jensen, S.
- Source
- Full text @ Science
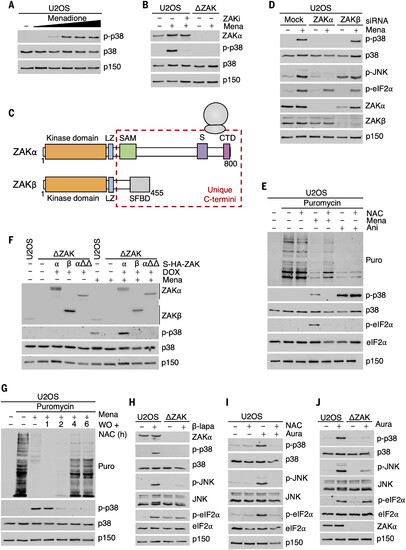
ROS inhibit translation and activate the RSR. (A) U2OS cells were treated with increasing concentrations of menadione (25, 50, 150, 250, and 500 μM for 1 hour). Lysates were analyzed by immunoblotting with the indicated antibodies. (B) WT U2OS cells or U2OS cells deleted for ZAK (ΔZAK) were treated with a ZAK inhibitor (ZAKi, 2 μM) and menadione (Mena, 250 μM for 1 hour). Lysates were analyzed as in (A). (C) Schematic of ZAK protein isoforms. LZ, leucine zipper; SAM, sterile alpha-motif; S, sensor domain; CTD, C-terminal domain; SFBD, stress fiber binding domain. (D) U2OS cells were transfected with control (mock) small interfering RNA (siRNA) or siRNAs targeting the α or β isoforms of ZAK. Cells were treated with menadione (250 μM for 1 hour), and lysates were analyzed as in (A). (E) U2OS cells were pretreated with NAC (10 mM for 1 hour) followed by addition of menadione (250 μM for 1 hour) or anisomycin (Ani, 1 μg/ml for 1 hour) as indicated. Puromycin (10 μg/ml) was added to the culture 10 min before harvest, and lysates were analyzed by immunoblotting with the indicated antibodies. (F) U2OS cells, ΔZAK cells, and ΔZAK cells rescued with WT and mutated forms of ZAKα and WT ZAKβ were treated as in (D) [αΔΔ is a deletion of the “S” and “CTD” domain in (C)]. Lysates were analyzed as in (A). (G) U2OS cells were treated with menadione (250 μM for 1 hour) followed by washout (WO) in the presence of NAC (10 mM) for the indicated times. Cells were pulse treated with puromycin (10 μg/ml, 10 min) before harvest as in (E). Lysates were analyzed as in (A). (H) Cells from (B) were treated with ROS-generating β-lapachone (β-lapa, 20 μM for 1 hour) and lysates were analyzed as in (A). (I) U2OS cells were pretreated with NAC (10 mM for 1 hour), followed by addition of auranofin (Aura, 5 μM for 1 hour) as indicated. Lysates were analyzed as in (A). (J) Cells from (B) were treated with auranofin (5 μM for 1 hour), and lysates were analyzed as in (A). |
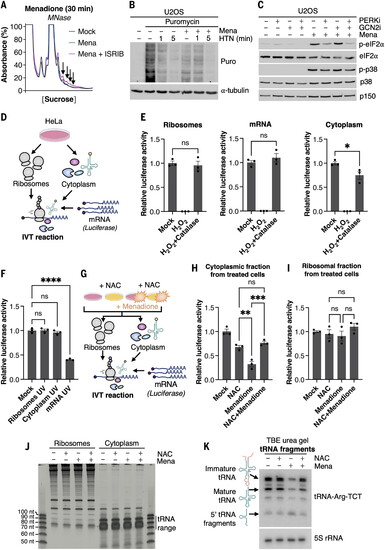
ROS-induced ZAKα activation is associated with ribosome stalling and collision. (A) U2OS cells were treated with menadione (Mena, 250 μM for 30 min) and ISRIB (200 nM). Lysates were digested with MNase and separated on a linear sucrose gradient. Arrows highlight UV peaks that are indicative of increased ribosome collision. (B) U2OS cells were pretreated with menadione (250 μM for 1 hour) as indicated and harringtonine (HTN, 2 μg/ml) for the indicated times to induce ribosome run-off. Puromycin (10 μg/ml) was added to the culture for 5 min before harvest (but after HTN incubation time) and lysates were analyzed by immunoblotting with the indicated antibodies. (C) U2OS cells were treated with menadione (250 μM for 1 hour) and inhibitors (i, 1 μM) against PERK and GCN2 as indicated. Lysates were analyzed as in (B). (D) Schematic of tripartite in vitro translation (IVT) approach. Ribosomes, ribosome-free cytoplasm, and mRNA can be individually treated before combination. (E) The three fractions from (D) were individually treated with hydrogen peroxide (10 min) and neutralized by the addition of catalase as indicated. Translation efficiency in the combined reaction was determined by luciferase assay. (F) As in (E), except that the fractions were individually irradiated with UVB (500 J/m2) before in vitro translation. (G) Schematic of modified tripartite IVT assay. In contrast to (D), HeLa cells were pretreated with NAC (10 mM for 1 hour), followed by addition of menadione (250 μM for 1 hour) before purification of fractions. (H) Combined IVT reactions with treated with ribosome-free cytoplasm from (G). (I) As in (H), except that treated ribosomes from (G) were used. All values indicate luciferase activity normalized to the control. For (E), (F), (H), and (I), data are plotted as means, and all error bars represent the SEM (n = 3 biological replicates). ns, nonsignificant; *P ≤ 0.05; **P ≤ 0.01; ***P ≤ 0.001; ****P ≤ 0.0001 by Student’s t test for two groups and one-way ANOVA with Tukey’s post hoc test for more than two groups. (J) Whole-cell RNA isolated from HeLa cell fractions from (G) was separated on urea agarose gel and stained for RNA. nt, nucleotides. (K) Northern blot for tRNA-Arg-TCT on RNA samples from (J). Schematic of tRNA intermediates corresponding to distinct bands are shown on the left side of the blot. |

ZAKα mediates menadione-induced apoptosis and death in zebrafish. (A) U2OS cells were treated with menadione (250 μM) for the indicated times. Lysates were analyzed by immunoblotting with the indicated antibodies. (B) U2OS cells individually deleted for ZAK (ΔZAK), ASK1 (ΔASK1), and both (ΔZAK/ΔASK1) were treated with menadione (250 μM) for the indicated times. Lysates were analyzed as in (A). (C) Model of ROS-induced activation of p38 and JNK kinases by parallel sensing mechanisms. ZAKα responds to ROS-induced impairment of ribosomal translation (left), whereas ASK1 activity is directly controlled by intracellular ROS levels (right). (D) Genomic location of guide RNA sequences (blue) and derived knockout alleles in exon 2 of zebrafish zakα (top) and zakβ (bottom) genes. A 33-bp insertion in mutated zakβ is highlighted in red, with the position of an in-frame STOP codon underlined and in bold. PAM, protospacer adjacent motif. (E) Genotyping of WT and CRISPR-modified alleles of zakα and zakβ genes from (D). A single zebrafish larva per genotype was lysed and submitted to genomic PCR with the indicated primer pairs. Amplified bands were resolved by agarose gel electrophoresis. (F) Schematic of experiments with menadione treatment of zebrafish larvae. Zebrafish eggs were incubated in the presence of menadione (9 μM) and/or NAC (60 μM) from 6 hours postfertilization and up to 5 days. Larvae were scored as dead or alive once per day, and the number of fish with developmental phenotypes was determined. For detection of apoptosis, larvae treated for 3 days were fixed and subjected to TUNEL staining. (G) Thirty zebrafish larvae with each of the indicated genotypes were treated and scored as in (F). Only larvae with cardiac arrest were scored as dead. The data shown are from one representative experiment out of the three performed. dpf, days post fertilization. (H) Representative images of larvae from (G) at day 3. WT fish treated with menadione (Mena) presented with darkened yolk sac, cardiac edema, and short kinked tails (red arrows). The addition of NAC or deletion of zakα largely obliviated these pathologies. (I) WT and zakα−/− larvae were treated as in (F) for 3 days, fixed, and subjected to TUNEL staining. Photographs show representative images of the tail part of the larvae. All scale bars, 500 μm. PHENOTYPE:
|

ZAK−/− mice are protected against obesity-associated metabolic dysfunction. (A) Schematic of mouse feeding experiment. Ten- to 12-week-old male WT (n = 13) and ZAK−/− (n = 12) mice were maintained on chow and subjected to MR scanning and ipGTT 2 weeks before shifting to a HFHS diet. Mice were subjected to MR scanning and ipGTT after a further 8 and 19 weeks of HFHS feeding. Mice were euthanized and tissues were collected 25 weeks after the diet shift. (B) Percent body weight gain of mice from (A). Arrows mark the time of IpGTT assay and resulting transient weight loss. (C) Blood glucose concentrations of mice from (A) subjected to ipGTT assay. (D) HOMA-IR of mice from (A). (E) Blood glucose concentration of mice from fig. S4I subjected to the IpITT at the 8-week time point (WT, n = 12; ZAK−/−, n = 7). (F) Liver triglyceride content of mice in (A). (G) Scoring of liver steatosis grade (scale, 0 to 4) of mice from (A). (H) Images of representative hematoxylin & eosin (H&E)–stained WT and ZAK−/− liver sections from mice in (A). Arrows indicate areas of steatosis. For (B) to (F), all data are plotted as mean and all error bars represent the SEM. For (C) and (E), statistical analysis is based on the area under the curve (AUC) for each experimental group. *P ≤ 0.05; **P ≤ 0.01 by Welch’s t test in (D) and (F) and Mann-Whitney U test in (C) and (E). All scale bars, 50 μm. |
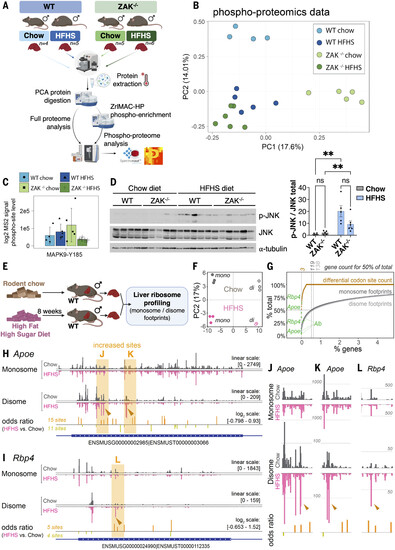
Ribosome profiling of monosome and disome footprints reveals discreet changes to the translation landscape upon HFHS feeding. (A) Experimental design and workflow for proteomic and phosphoproteomic profiling of mouse livers. Ten- to 12-week-old mice of the indicated genotypes were fed chow or HFHS for 5 weeks (n = 4 to 6). (B) PCA of the phosphoproteomic profiles of mouse livers from (A). (C) Barplots of intensities derived from MS2 data for activation-associated phosphorylation sites on MAPK9 (JNK2). Height of the bars represents the average of the measurements and error bars the SE. Missing values in the MS data are plotted as zero values. (D) Lysates of livers from (A) were analyzed by immunoblotting with the indicated antibodies (left) and p-JNK divided by total JNK signals was quantified (right). Data are plotted as mean, and all error bars represent the SEM. *P ≤ 0.05; **P ≤ 0.01 by two-way ANOVA with Tukey’s post hoc test. (E) Schematic of in vivo monosome and disome profiling experiment. Twelve-week-old male WT mice were fed normal chow or a HFHS diet for 8 weeks (n = 3). (F) PCA on monosome (closed circles) and disome (open circles) footprint data from individual mice, using the top 500 expressed genes. (G) Contribution of the most prominent genes to cumulative total signal for monosome footprints (dark gray), disome footprints (light gray), and differential codon sites from fig. S8C (orange). The locations of Alb, Apoe, and Rbp4 in the cumulative datasets are highlighted. (H) Position-specific A-site signal for monosome and disome footprints across the Apoe mRNA for chow-fed (gray) and HFHS-fed (pink) conditions. Below monosome and disome tracks, positions of differential codon sites are depicted, with height corresponding to odds ratio values, and the same color coding is used as in fig. S8C. (I) As in (H) but for Rbp4. (J) Magnification of the left highlighted region of Apoe from (H) with high disome signal specifically in HFHS, and neighboring differential codon sites, consistent with increased collisions in this area. (K) As in (J) but for the right highlighted region. (L) As in (J) and (K) but for the high-disome site from the Rbp4 transcript in (I). |

Healthy metabolic aging in male ZAK−/− mice. (A) Schematic of mouse aging experiment. WT (male, n = 7; female, n = 16) and ZAK−/− (male, n = 7; female, n = 12) mice were maintained on a normal chow diet until 14 to 16 months of age (“old group”). Mice were subjected to ipGTT and euthanized 2 weeks later for collection of tissues. Tissues from 6-month-old WT and ZAK−/− male mice (“young group”) were used for comparison. (B) Blood glucose concentrations of “old” male (top) and female (bottom) mice from (A) subjected to ipGTT assay. Statistical analysis is based on the AUC for each experimental group. (C to E) Basal glucose levels (C), basal insulin levels (D), and HOMA-IR (E) of fasted “old” male mice from (A). (F) Images of representative H&E-stained liver section from male mice in (A). Arrows indicate areas of steatosis. (G) Scoring of liver steatosis grade (scale, 0 to 4) of male mice from (A). (H) Images of representative H&E-stained sections of BAT from male mice in (A). Arrows indicate areas of notable lipid droplet condensation and BAT whitening. (I) Whole-mount BAT scans from (fig. S10A) were segmented according to lipid droplets. Individual droplet sizes for all aged WT and ZAK−/− samples were computed and represented in the form of histograms (n = 6). (J) Model of metabolic regulation by the RSR in obesity and aging in male mice. ROS produced as a result of HFHS feeding or during the course of aging impair ribosomal translation and activate the RSR sensor ZAKα. Downstream MAP kinase (p38 and JNK) signaling mediates features of metabolic decline such as glucose intolerance, liver steatosis, and BAT whitening. For (B) to (E), all data are plotted as mean and all error bars represent the SEM. *P ≤ 0.05; **P ≤ 0.01 by Welch’s t test in (C) and by Mann-Whitney U test in (B), (D), and (E). All scale bars, 50 μm. |

|

ZFIN is incorporating published figure images and captions as part of an ongoing project. Figures from some publications have not yet been curated, or are not available for display because of copyright restrictions. EXPRESSION / LABELING:
PHENOTYPE:
|