
Fig. 5
- ID
- ZDB-IMAGE-240229-102
- Publication
- Snieckute et al., 2023 - ROS-induced ribosome impairment underlies ZAKα-mediated metabolic decline in obesity and aging
- All Figures
- Figures for Snieckute et al., 2023
|
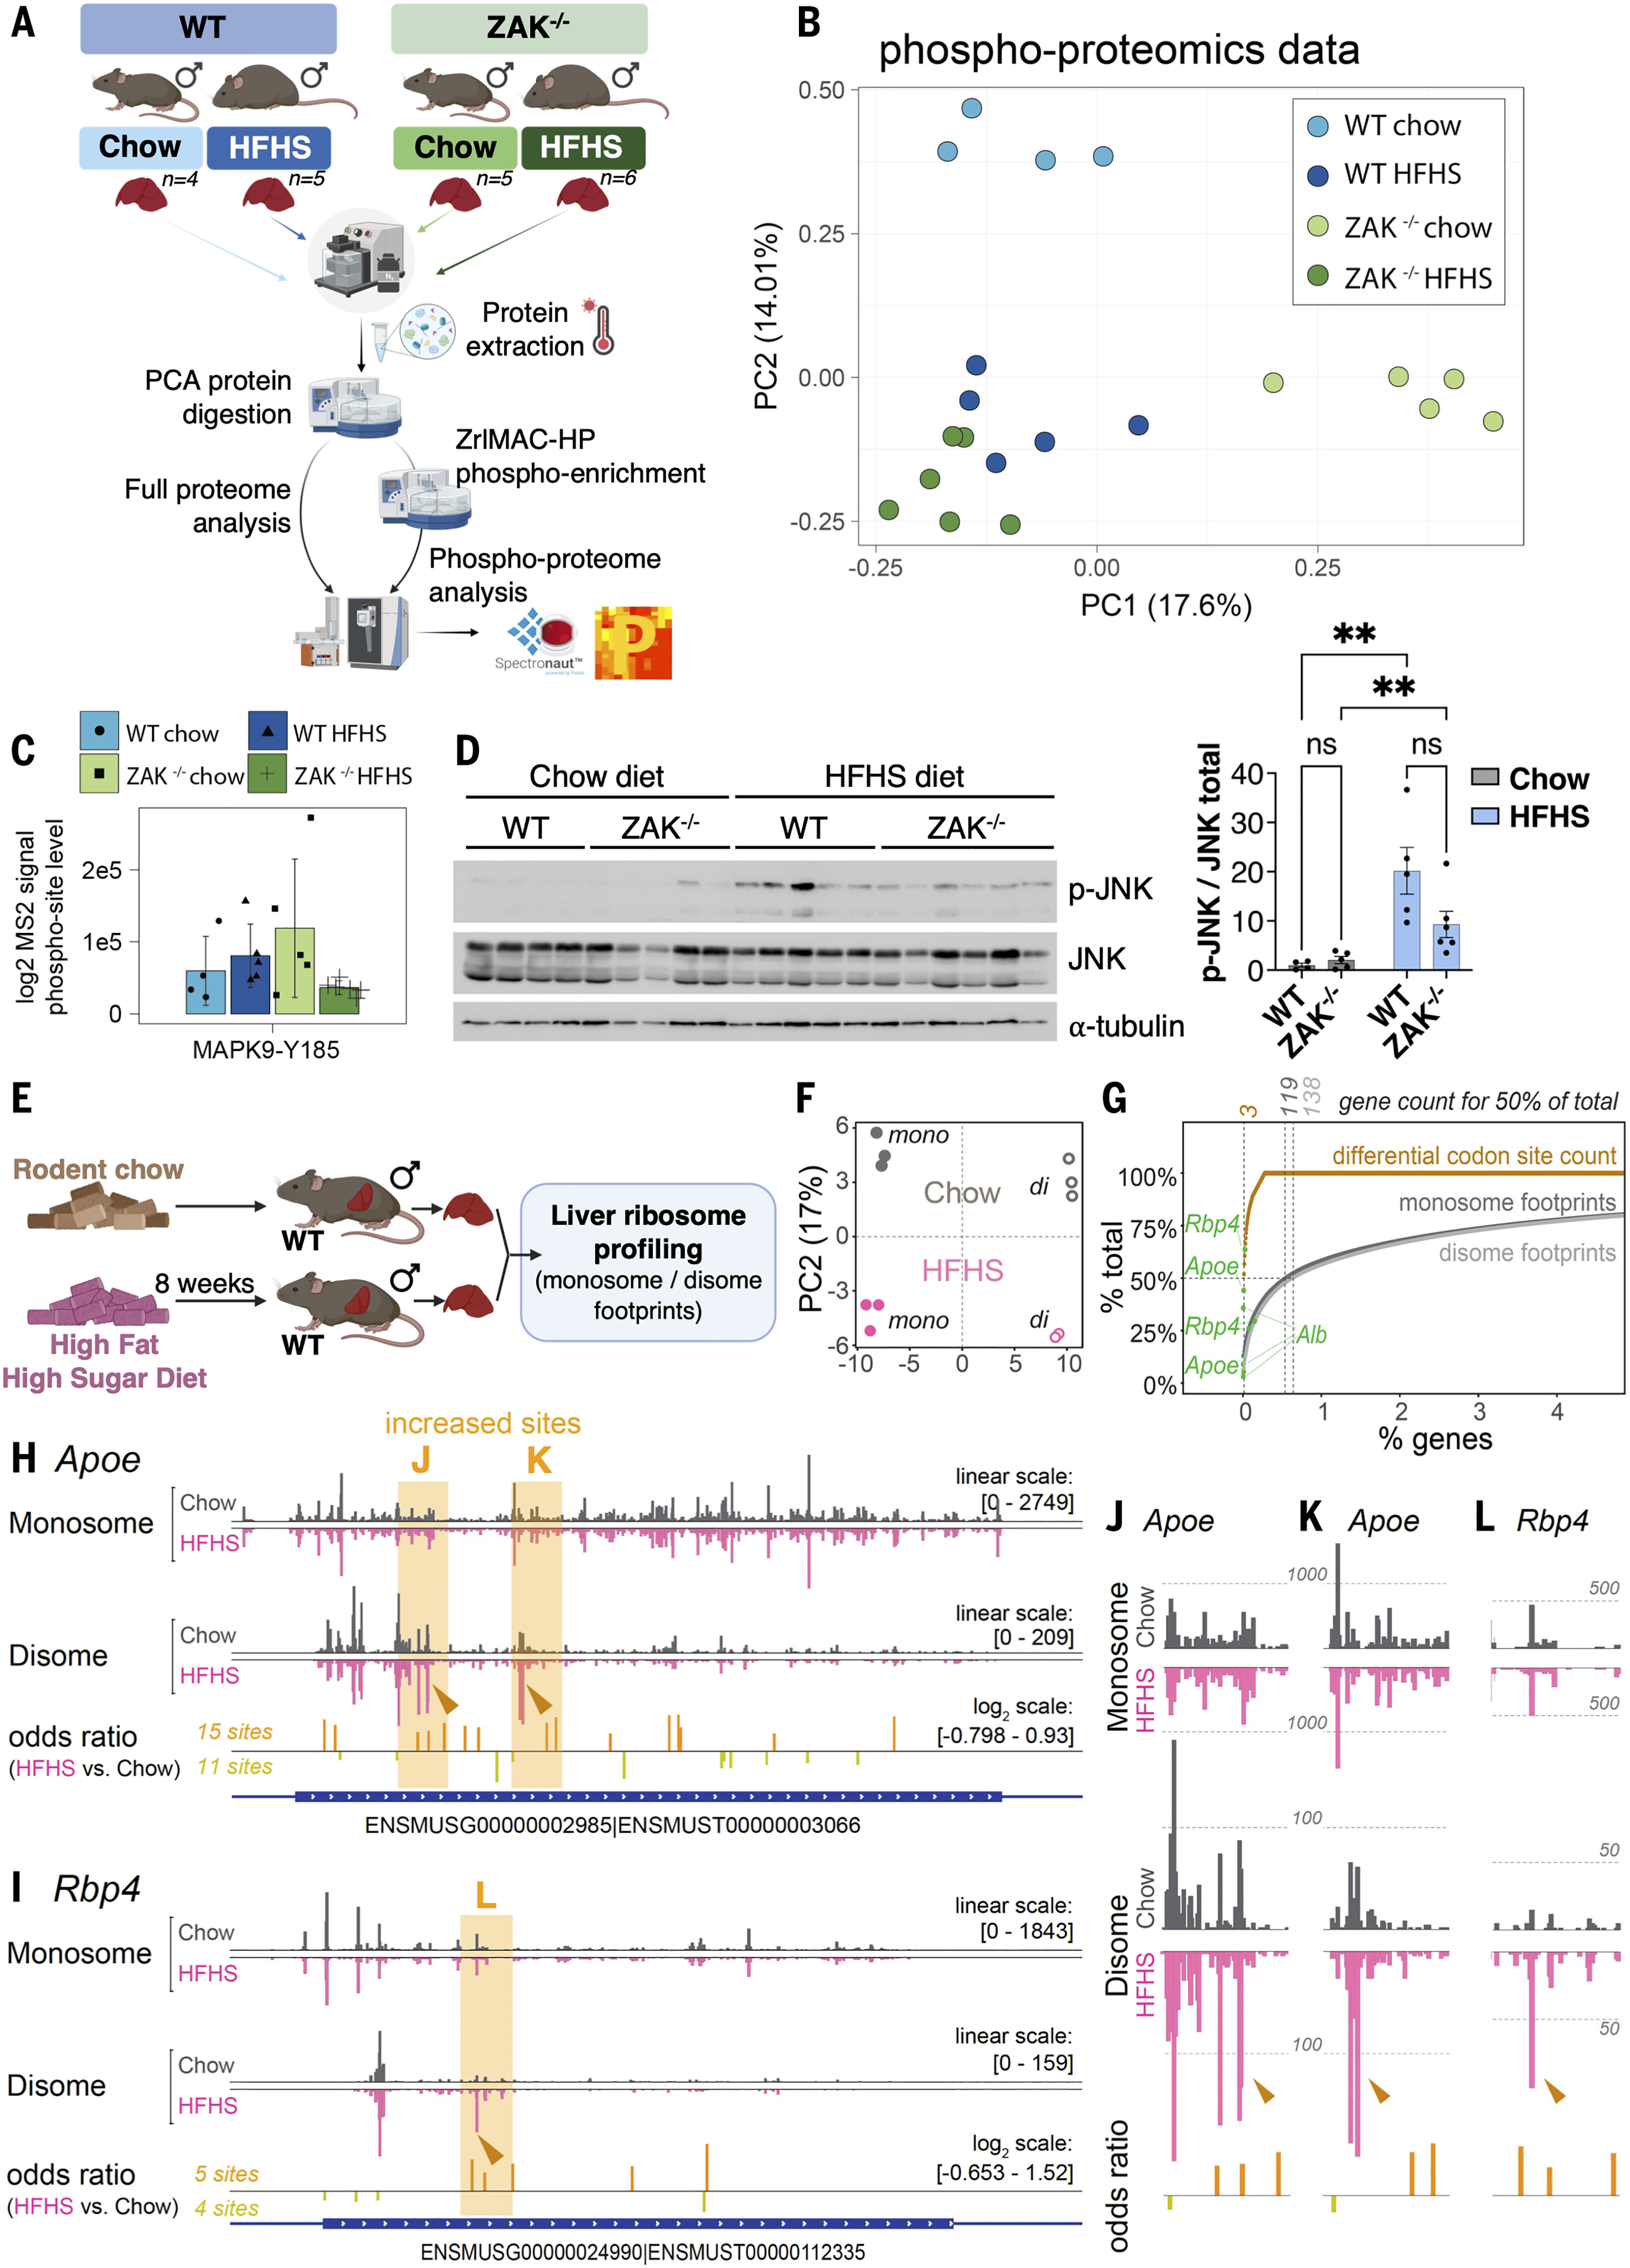
Fig. 5 Ribosome profiling of monosome and disome footprints reveals discreet changes to the translation landscape upon HFHS feeding. (A) Experimental design and workflow for proteomic and phosphoproteomic profiling of mouse livers. Ten- to 12-week-old mice of the indicated genotypes were fed chow or HFHS for 5 weeks (n = 4 to 6). (B) PCA of the phosphoproteomic profiles of mouse livers from (A). (C) Barplots of intensities derived from MS2 data for activation-associated phosphorylation sites on MAPK9 (JNK2). Height of the bars represents the average of the measurements and error bars the SE. Missing values in the MS data are plotted as zero values. (D) Lysates of livers from (A) were analyzed by immunoblotting with the indicated antibodies (left) and p-JNK divided by total JNK signals was quantified (right). Data are plotted as mean, and all error bars represent the SEM. *P ≤ 0.05; **P ≤ 0.01 by two-way ANOVA with Tukey’s post hoc test. (E) Schematic of in vivo monosome and disome profiling experiment. Twelve-week-old male WT mice were fed normal chow or a HFHS diet for 8 weeks (n = 3). (F) PCA on monosome (closed circles) and disome (open circles) footprint data from individual mice, using the top 500 expressed genes. (G) Contribution of the most prominent genes to cumulative total signal for monosome footprints (dark gray), disome footprints (light gray), and differential codon sites from fig. S8C (orange). The locations of Alb, Apoe, and Rbp4 in the cumulative datasets are highlighted. (H) Position-specific A-site signal for monosome and disome footprints across the Apoe mRNA for chow-fed (gray) and HFHS-fed (pink) conditions. Below monosome and disome tracks, positions of differential codon sites are depicted, with height corresponding to odds ratio values, and the same color coding is used as in fig. S8C. (I) As in (H) but for Rbp4. (J) Magnification of the left highlighted region of Apoe from (H) with high disome signal specifically in HFHS, and neighboring differential codon sites, consistent with increased collisions in this area. (K) As in (J) but for the right highlighted region. (L) As in (J) and (K) but for the high-disome site from the Rbp4 transcript in (I).