FIGURE SUMMARY
Title

Myeloid cells interact with a subset of thyrocytes to promote their migration and follicle formation through NF-κB

Authors
Yang, R.M., Song, S.Y., Wu, F.Y., Yang, R.F., Shen, Y.T., Tu, P.H., Wang, Z., Zhang, J.X., Cheng, F., Gao, G.Q., Liang, J., Guo, M.M., Yang, L., Zhou, Y., Zhao, S.X., Zhan, M., Song, H.D.
Source
Full text @ Nat. Commun.

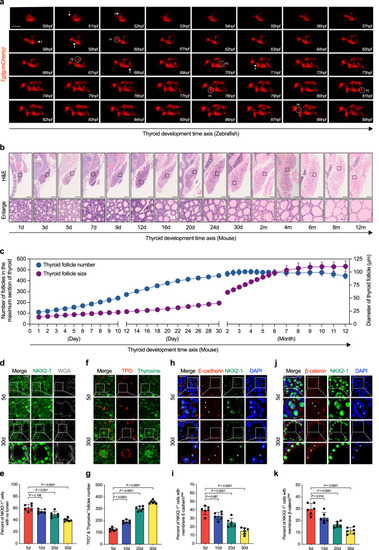
Gradual transformation of solid primordium into arborized follicles in mice and zebrafish.

a In vivo continuous observation thyroid folliculogenesis of zebrafish embryos from 50 hpf to 89 hpf with one hour interval under thyroglobulin promoter driven mCherry transgenic line (tg:mCherry). b Representative images showing histological analysis at the maximum sections of mice thyroid tissues by H&E staining from postnatal day 1 to 12 months with age shown in the lower panel. c Thyroid follicle numbers (y axis on the left) and average follicle diameter (y axis on the right) calculated at the maximum sections of thyroid tissues as time indicated (x axis). d Representative images showing the arrangement of NKX2-1 positive thyroid epithelial cells at postnatal day 5 and 30 mice thyroid glands by immunofluorescence analysis (IF). WGA used to stain the membrane. e Statistical estimation of the fraction of NKX2-1 positive thyrocytes without lumen formation. f Representative images showing the expression of TPO and Thyroxine at postnatal day 5 and 30 mice thyroid glands by IF. Many TPO positive thyrocytes that had yet to form follicles were found to be thyroxine negative in postnatal day 5 thyroid tissues when compared to postnatal day 30 mice thyroid tissues. g Statistical estimation of the percentage of TPO positive lumen with thyroxine secreted. hk Representative images showing the expression of E-cadherin (h) or β-catenin (j) among NKX2-1 positive thyrocytes at postnatal day 5 and 30 mice thyroid glands by IF. NKX2-1 positive thyrocytes marked with asterisks in postnatal day 5 were membrane E-cadherin (h) or β-catenin (j) low, in comparison with the clear establishment of epithelial adhesion in postnatal day 30 (also marked with white asterisks). Statistical assessment of the percentage of NKX2-1 positive thyrocytes with low membrane E-cadherin (i) or β-catenin (k) expression. Scale bar, 50 μm in (a, d, f, h, j), and 200 μm in (b). n = 6 biologically independent samples in (c, e, g, i), and (k). Data are shown as mean ± SD. Statistical significance was determined by One-way ANOVA, followed by Tukey’s multiple comparison test. Source data are provided as a Source data file.

Identification of motile thyrocytes by scRNA-seq from the developing mice thyroid tissues.

a Dot plot of thyroid specification (marked in black) and function related genes (marked in red) expression in thyrocytes at each time point. b Dot plot of cellular adhesion and motility related genes expressed in thyrocytes at each time point in postnatal mice thyroid tissues (left axis). c Representative images and statistical assessment showing the percentage of Vimentin positive thyrocytes (stained by NKX2-1) from postnatal day 5 to 30 mice thyroid tissues. d Representative images, and statistical assessment showing the MCAM positive thyrocytes in postnatal day 5 and 30 mice thyroid tissues by using IF staining. e Representative images, and statistical assessment of RNA-scope analysis of map4k4 positive thyrocytes (stained by Pax8 as a marker for thyrocyte) from postnatal day 5 to 30 mice thyroid tissues. f UMAP of TFC and split by time point. Cells are colored and annotated by cell subtype. g Bar plot shown the proportion of TFC subtypes among all TFC at each time point examined. h GO enrichment analysis of the DEGs that specifically enriched in TFC-1 and TFC-2 subtype respectively. i KEGG analysis of the DEGs distinguishing the TFC-1 subtypes. j Analysis of “HALLMARK_TNFA_SIGNALING_VIA_NFKB” gene set between TFC-1 and TFC-2 cells by GSEA software, the NES and FDR P value were shown. k Dot plot of TNF-α-NF-κB pathway genes expression in TFC cluster at each time point in postnatal mice thyroid tissues. For (a, b and k), color of dots represents z-scored of the gene expression level, and size of dots represents percent of TFC with at least one UMI detected per gene. In (c, d and e), Scale bar, 50 μm. n = 6 biologically independent samples. Data are shown as mean ± SD. Statistical significance was determined by One-way ANOVA, followed by Tukey’s multiple comparison test. In (h and i), P value was determined by Benjamini-Hochberg-adjusted one-sided hypergeometric test. Source data are provided as a Source data file.

NF-κB is activated in the central immature thyrocytes of mice by spatial transcriptome sequencing.

a From left to right in turn show the H&E staining, cell type annotation and representative marker genes expression in thyroid tissues. PTC: Parathyroid cells (PTC), TFC: thyroid epithelial cells (TFC), Adipo: adipocyte. Dot color intensity represents the z-score of gene expression values. b Multimodal intersection analysis (MIA) map of all scRNA-seq-identified cell types and ST-defined regions. P value calculated by hypergeometric test. The numbers of cell type- and tissue region-specific genes used in the calculation are shown in the brackets. c MIA analysis was utilized to examine the relation between scRNA-seq-identified TFC subtypes and ST-defined TFC subclusters. Based on our ST-seq data, UMAP analysis identified two TFC subclusters (c1), one of which was in the central of thyroid tissues and the other in the peripheral region (c2). Genes with significantly higher expression in each spatial region relative to the others were then identified (c3). The overlap between each pair of cell type-specific and tissue region-specific gene sets was analyzed using MIA (c4). The significance of the intersection was displayed using the hypergeometric distribution. (c5). The numbers of cell subtype-specific and tissue region-specific genes used in the calculation are shown in the brackets. d GO enrichment analysis of the DEGs between TFC-central and TFC-peripheral. e KEGG analysis of the TFC-central highly expressed genes. Red dots signify the genes in the TNF and NF-κB signaling pathway. f Analysis of “HALLMARK_TNFA_SIGNALING_VIA_NFKB” gene set between TFC-central and TFC-peripheral spots by GSEA software, the NES and FDR P value were shown. g Fold changes of TNF-α-NF-κB pathway genes comparing TFC-central with TFC-peripheral cell spots. Dot color intensity represents the -log10P values (Two-tailed t test). The dotted horizontal line indicates fold change = 1, and the dotted vertical line show P = 0.05. Gene names marked in red were also highly expressed in TFC-1 subtype when compared with TFC-2 by scRNA-seq. In (d and e), P value was determined by Benjamini-Hochberg-adjusted one-sided hypergeometric test. Source data are provided as a Source data file.

NF-κB signaling is activated in TFC with higher migratory capacity in zebrafish and mice.

a, b Representative images (a) and statistical assessment (b) of the percentage of P65 positive thyrocytes, which are stained by Pax8 RNA probe from postnatal day 5 to 30 mice thyroid tissues. c P65 co-expression with TPO in postnatal day 5 mice thyroid tissues were analyzed by IF staining. Right two panels are enlarged ones collected from the peripheral (a’) and central (b’) region of the first column on the left respectively. Note that P65 positive cells were accumulated in the central region (b’), with apical TPO and lumen not established. d Cellular adhesion molecule E-cadherin expression in P65 positive cells in postnatal day 5 mice thyroid tissues were detected by IF staining. Right two panels are the enlarged ones of the first lane showing P65 positive cells in the central gland with membrane E-cadherin negative (a’) and P65 negative cells in the peripheral part with membrane E-cadherin positive (b’) respectively. e Representative images showing MCAM expression in P65 positive cells by IF in postnatal day 10 mice thyroid tissues. f Representative images showing Vimentin expression in P65 positive thyrocytes in postnatal day 5 mice thyroid tissue, labeled by white asterisks. g NF-κB activation in thyrocytes in zebrafish embryos at different time points were examined by the double transgenic Tg(nfκb:eGFP; tg:mCherry) line. The first columns in each panel show the whole mount embryos view of thyroid glands for each time point of embryos. The second and third columns are magnified and slice images of the first columns, respectively, to clearly show NF-κB activation in thyroid epithelial cells. Scale bar, 50 μm. Three independent experiments were carried for (cg). In (b), data are shown as mean ± SD, n = 6 biologically independent samples, and statistical significance was determined by One-way ANOVA, followed by Tukey’s multiple comparison test. Source data are provided as a Source data file.

NF-κB inhibition affect thyroid follicle formation in mice.

a The changes of body weight in mice treated by IKK2 inhibitor TPCA1. Yellow inverted triangles in X axis indicated the administration time of TPCA1, and the body weight of mice were measured every three days. Repeated measures ANOVA used for significance testing. b Representative image show the body size of mice treated by TPCA1 under stereoscope. The serum levels of T3 (c), T4 (d) and TSH (e) in the mice after treated with TPCA1 for one month. f Representative image of histology analysis of thyroid tissues at postnatal day 30 mice after treated with TPCA1. g Statistical assessment of follicle numbers formed at the maximum sections of thyroid tissues in mice treated with TPCA1. h Representative images showing TPO and Thyroxine levels in thyroid tissues of the postnatal day 30 mice treated with or without TPCA1. i Statistical measurement of TPO and thyroxine positive lumens (indicated of functional maturation) in thyroid tissues of the postnatal day 30 mice treated with TPCA1. j The expression of NKX2-1 and E-cadherin in thyroid tissues of postnatal day 30 mice treated with TPCA1 were detected by IF. k Statistical assessment of the percentage of thyroid epithelial cells clustering into solid mass (with no lumen formed and no polarized E-cadherin expression) in thyroid tissues of postnatal day 30 mice treated with TPCA1. Scale bar, 50 μm. n = 8 biologically independent samples in (a, c, d, e, g, i, k). Two-sided Student’s t test used. Data are shown as mean ± SD. Source data are provided as a Source data file.

Myeloid cells secrete Tnf-α to promote NF-κB activation in mice thyroid epithelial cells.

a The CD68 and Il-1β positive cells were identified in thyroid tissues of postnatal day 5, 10, 20, 30 mice by IF. b Representative images of IF analysis showing Tnf-α expression in CD68 positive macrophages (arrowheads) at postnatal day 10 mice thyroid tissues. Representative image and statistical analysis showing CD68-positive macrophages located near the P65 (c) or nuclear phosphorylated P65 (d) positive thyrocytes in thyroid tissues at postnatal day 10 mice by polychromatic immunofluorescence analysis. e Representative image showing the multi-color RNA scope analysis of Pax8 and Tnfrsf1a in postnatal day 10 mouse thyroid gland. The areas framed by the two white dashed lines correspond to the peripheral (a’, mature lumen has been established) and central (b’, immature solid mass appearance) of thyroid tissue, which are shown on the right. f Statistical assessment of the relative fluorescence intensity of Tnfrsf1a in the thyrocytes located in the central or peripheral thyroid tissues at postnatal day 10 mice. Of the 6 mice thyroid tissues examined, three fields of view for each were randomly selected for calculation the mean fluorescence intensity (divided by the number of cells) of Tnfrsf1a in the peripheral and central thyrocytes, respectively. Data are shown as mean ± SD, and and statistical significance was determined by Two-sided Student’s t test (f). Scale bar, 50 μm. Three independent experiments were carried for (a and b). For the statistical analysis in (c and d), 70 areas were randomly chosen under confocal microscopy from the slices of 7 postnatal day 10 mice thyroid tissues (10 areas for each), the areas were classified into two groups by whether CD68 positive cells existed. The presence of P65 (c) or nuclear phosphorylated P65 (d) positive cells or not in each group were summed respectively. Two-sided Fisher’s exact test to calculate the P value. Source data are provided as a Source data file.

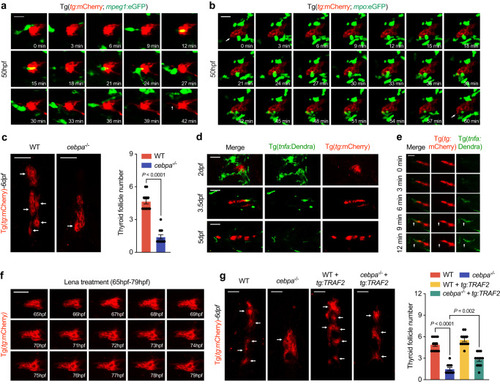
Cells of myeloid lineage secrete Tnf-α to promote NF-κB activation in zebrafish thyroid epithelial cells.

a In vivo continuous observation of the interaction between macrophages [Tg(mpeg:eGFP)] and thyroid epithelial cells [Tg(tg:mCherry)]. Arrowhead notifies the extension of front epithelial cell after frequent interactions. b Interaction between neutrophils [Tg(mpo:eGFP)] and thyroid epithelial cells [Tg(tg:mCherry)]. Arrowheads indicate the extrusion of front epithelial cell. c Representative image and statistical analysis showing follicles formed in 6dpf wild-type and cebpa-/- under Tg(tg:mCherry) background. d Tnf-α positive cells [Tg(tnfa:Dendra)] in touch with thyroid epithelial cells examined at times indicated on the left in zebrafish embryos. e In vivo continuous monitoring shows the interaction with Tnf-α positive cells promoted the extrusion of front thyroid epithelial cells. f Continuous in vivo observation of thyroid epithelial cell morphogenesis in zebrafish embryos treated with lenalidomide. g Representative images and statistical analysis of follicle numbers in wild-type and cebpa−/− with or without TRAF2 overexpression in thyrocytes. Scale bar, 50 μm. Three independent experiments were carried for (a and b). In (c and g), data are shown as mean ± SD (n = 12 zebrafish/group, significance was determined by two-side Student’s t test or one-way ANOVA with post Tukey’s multiple comparisons test). Source data are provided as a Source data file.

Acknowledgments
This image is the copyrighted work of the attributed author or publisher, and ZFIN has permission only to display this image to its users. Additional permissions should be obtained from the applicable author or publisher of the image. Full text @ Nat. Commun.