|
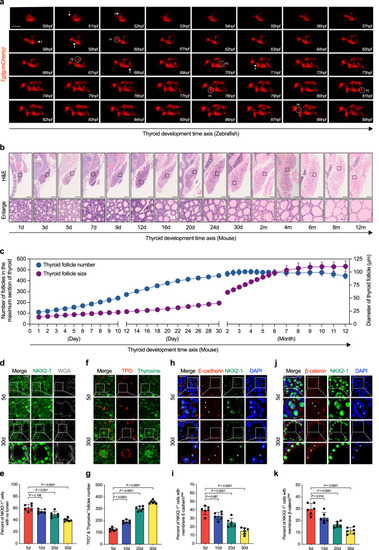
Gradual transformation of solid primordium into arborized follicles in mice and zebrafish. a In vivo continuous observation thyroid folliculogenesis of zebrafish embryos from 50 hpf to 89 hpf with one hour interval under thyroglobulin promoter driven mCherry transgenic line (tg:mCherry). b Representative images showing histological analysis at the maximum sections of mice thyroid tissues by H&E staining from postnatal day 1 to 12 months with age shown in the lower panel. c Thyroid follicle numbers (y axis on the left) and average follicle diameter (y axis on the right) calculated at the maximum sections of thyroid tissues as time indicated (x axis). d Representative images showing the arrangement of NKX2-1 positive thyroid epithelial cells at postnatal day 5 and 30 mice thyroid glands by immunofluorescence analysis (IF). WGA used to stain the membrane. e Statistical estimation of the fraction of NKX2-1 positive thyrocytes without lumen formation. f Representative images showing the expression of TPO and Thyroxine at postnatal day 5 and 30 mice thyroid glands by IF. Many TPO positive thyrocytes that had yet to form follicles were found to be thyroxine negative in postnatal day 5 thyroid tissues when compared to postnatal day 30 mice thyroid tissues. g Statistical estimation of the percentage of TPO positive lumen with thyroxine secreted. h–k Representative images showing the expression of E-cadherin (h) or β-catenin (j) among NKX2-1 positive thyrocytes at postnatal day 5 and 30 mice thyroid glands by IF. NKX2-1 positive thyrocytes marked with asterisks in postnatal day 5 were membrane E-cadherin (h) or β-catenin (j) low, in comparison with the clear establishment of epithelial adhesion in postnatal day 30 (also marked with white asterisks). Statistical assessment of the percentage of NKX2-1 positive thyrocytes with low membrane E-cadherin (i) or β-catenin (k) expression. Scale bar, 50 μm in (a, d, f, h, j), and 200 μm in (b). n = 6 biologically independent samples in (c, e, g, i), and (k). Data are shown as mean ± SD. Statistical significance was determined by One-way ANOVA, followed by Tukey’s multiple comparison test. Source data are provided as a Source data file.
|