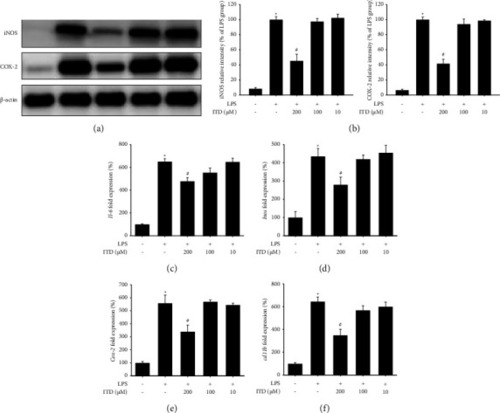
Effect of isotetrandrine (ITD) on LPS-induced iL-6, iNOS, and COX-2 mRNA and protein expression in BV2 cell. BV2 microglia cells were cotreated with LPS and different concentrations of isotetrandrine (ITD) (200, 100, and 10 μM) for 24 hr and harvested for western blots and qPCR. (a) Western blots for iNOS, COX-2, and β-actin protein expression in each group. (b) Quantification results of relative density of iNOS and COX-2 expression in each group. The relative density of the LPS-induced group was taken to be 100%. β-actin was used as an internal control. (c–f) Quantitative PCR of interleukin-6 (Il-6), inducible nitric oxide synthase (Inos), and cyclooxygenase-2 (Cox-2) and cd11b mRNA expression in each group. Gapdh was used as an internal control. Data are presented as mean ± SEM (n = 3). Significantly different from the control group; p  <  0.05; #significantly different from the LPS group.

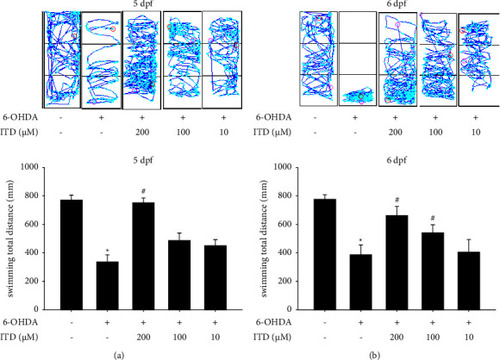
Effect of ITD on 6-OHDA-induced locomotor deficiency in zebrafish. Zebrafish larvae were pretreated with 200, 100, or 10 μM ITD from 9 h postfertilization (hpf) to 5 dpf and then challenged with 250 μM 6-OHDA from 2 to 5 dpf. The locomotor activity of zebrafish was measured at (a) 5 dpf and (b) 6 dpf. The upper panel shows a representative pattern, and the lower panel shows average results. Data are presented as mean ± SEM (n = 16). significantly different from the control group; #significantly different from the 6-OHDA group; p  <  0.05.

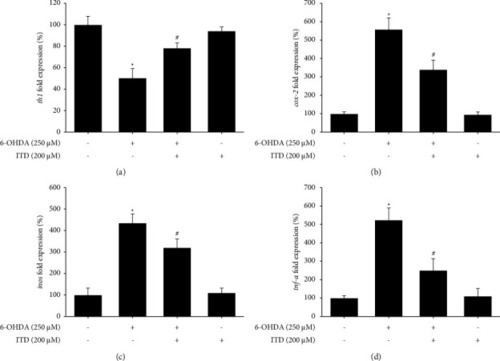
Effect of ITD on 6-OHDA-induced modulation of inflammation-related mRNA expression in zebrafish. Zebrafish larvae were pretreated with 200 μM ITD from 9 hpf to 5 dpf and then challenged with 250 μM 6-OHDA from 2 to 5 dpf and harvested at 5 dpf for qPCR. (a–d) Quantitative PCR results of tyrosine hydroxylase (th1), inos, cox-2, and tumor necrosis factor-α (tnf-α) in each group. Data are presented as mean ± SEM. Each sample contained pooled material from twenty fish. significantly different from the control group; #significantly different from the 6-OHDA group, p  <  0.05.

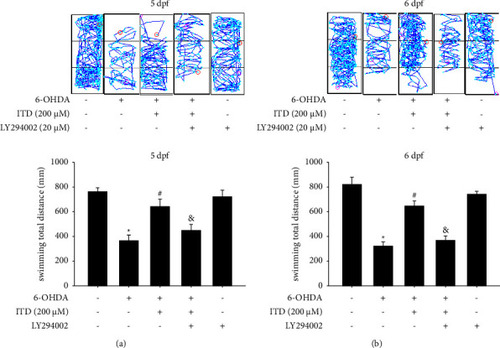
Effect of LY294002 on ITD neuroprotective effect in 6-OHDA-treated zebrafish. Zebrafish larvae were pretreated with 20 μM LY294002 and 200 μM ITD from 9 hpf to 5 dpf and then challenged with 250 μM 6-OHDA from 2 to 5 dpf. The locomotor activity was measured at (a) 5 dpf and (b) 6 dpf. The upper panel shows a representative pattern, and the lower panel shows average results. Data are presented as mean ± SEM (n = 16). significantly different from the control group; #significantly different from the 6-OHDA group; &, significantly different from the 6-OHDA plus ITD group, p  <  0.05.

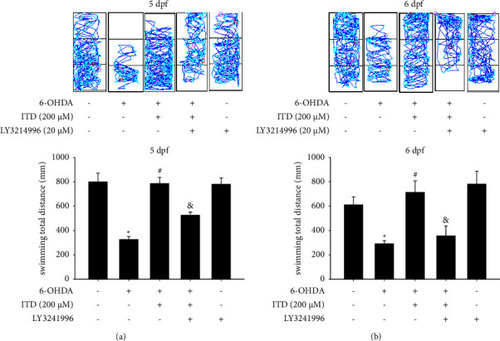
Effect of LY3214996 on ITD neuroprotective effect in 6-OHDA-treated zebrafish. Zebrafish larvae were pretreated with 20 μM LY3214996 and 200 μM ITD from 9 hpf to 5 dpf and then challenged with 250 μM 6-OHDA from 2 to 5 dpf. The locomotor activity was measured at (a) 5 dpf and (b) 6 dpf. The upper panel shows a representative pattern, and the lower panel shows average results. Data are presented as mean ± SEM (n = 16). significantly different from the control group; #significantly different from the 6-OHDA group; &, significantly different from the 6-OHDA plus ITD group; p  <  0.05.

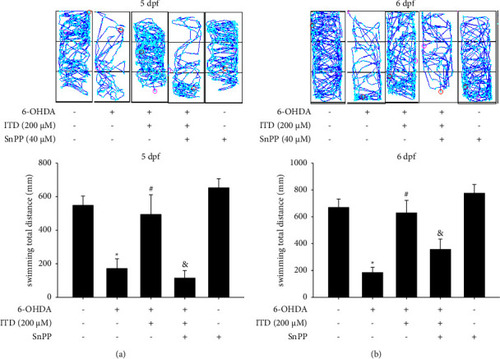
Effect of SnPP on ITD neuroprotective effect in 6-OHDA-treated zebrafish. Zebrafish larvae were pretreated with 40 μM SnPP and 200 μM ITD from 9 hpf to 5 dpf and then challenged with 250 μM 6-OHDA from 2 to 5 dpf. The locomotor activity was measured at (a) 5 dpf and (b) 6 dpf. The upper panel shows a representative pattern, and the lower panel shows average results. Data are presented as mean ± SEM (n = 16). significantly different from the control group; #significantly different from the 6-OHDA group; &, significantly different from the 6-OHDA plus ITD group; p  <  0.05.

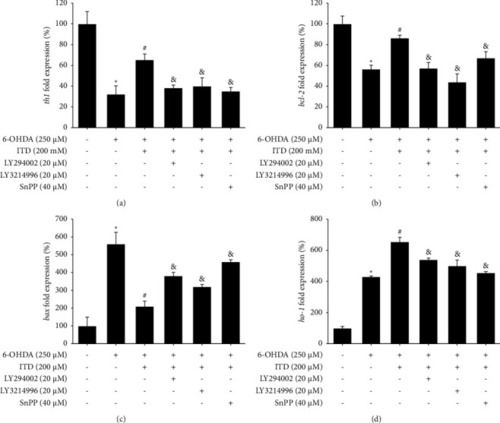
Effect of LY294002, LY3214996, and SnPP on ITD antiapoptotic effect in 6-OHDA-treated zebrafish in mRNA level. Zebrafish larvae were pretreated with 20 μM LY294002, 20 μM LY3214996, or 40 μM SnPP, and 200 μM ITD from 9 hpf to 5 dpf and then challenged with 250 μM 6-OHDA from 2 to 5 dpf and harvested at 5 dpf for qPCR. Quantitative PCR results of (a) th1, (b) bcl-2, (c) bax, and (d) ho-1 at (a) 5 dpf and (b) 6 dpf. Data are presented as mean ± SEM (n = 3). Each sample contained pooled material from twenty fish. significantly different from the control group; #significantly different from the 6-OHDA group; &, significantly different from the 6-OHDA plus ITD group; p  <  0.05.

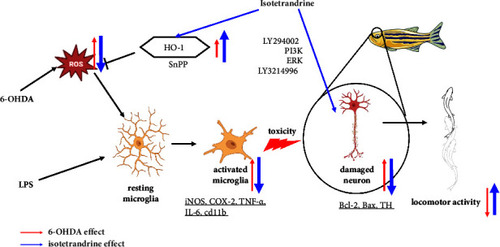
Schematic diagram of mechanism of ITD in 6‐OHDA‐induced cell death.

Acknowledgments
This image is the copyrighted work of the attributed author or publisher, and ZFIN has permission only to display this image to its users. Additional permissions should be obtained from the applicable author or publisher of the image. Full text @ Parkinsons Dis