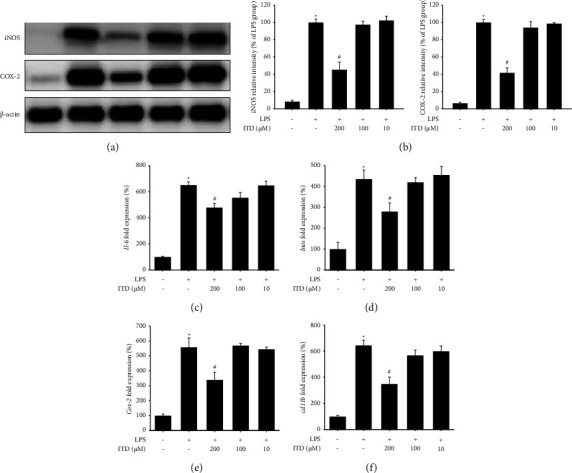
IMAGE

Figure 1

ID
ZDB-IMAGE-231019-12
Source
Figures for Wu et al., 2023
Image
Figure Caption

Figure 1

Effect of isotetrandrine (ITD) on LPS-induced iL-6, iNOS, and COX-2 mRNA and protein expression in BV2 cell. BV2 microglia cells were cotreated with LPS and different concentrations of isotetrandrine (ITD) (200, 100, and 10 μM) for 24 hr and harvested for western blots and qPCR. (a) Western blots for iNOS, COX-2, and β-actin protein expression in each group. (b) Quantification results of relative density of iNOS and COX-2 expression in each group. The relative density of the LPS-induced group was taken to be 100%. β-actin was used as an internal control. (c–f) Quantitative PCR of interleukin-6 (Il-6), inducible nitric oxide synthase (Inos), and cyclooxygenase-2 (Cox-2) and cd11b mRNA expression in each group. Gapdh was used as an internal control. Data are presented as mean ± SEM (n = 3). Significantly different from the control group; p  <  0.05; #significantly different from the LPS group.

Acknowledgments
This image is the copyrighted work of the attributed author or publisher, and ZFIN has permission only to display this image to its users. Additional permissions should be obtained from the applicable author or publisher of the image. Full text @ Parkinsons Dis