
- Title
-
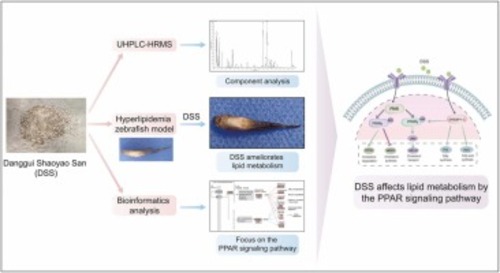
Danggui Shaoyao San ameliorates the lipid metabolism via the PPAR signaling pathway in a Danio rerio (zebrafish) model of hyperlipidemia
- Authors
- Wang, Y., Pan, Y., Hou, M., Luo, R., He, J., Lin, F., Xia, X., Li, P., He, C., He, P., Cheng, S., Song, Z.
- Source
- Full text @ Biomed. Pharmacother.
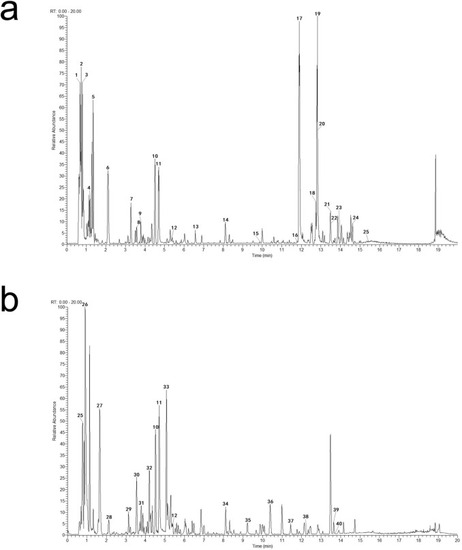
BPC figure of Danggui Shaoyao San (DSS) in positive ion mode (A) and in negative ion mode (B). |
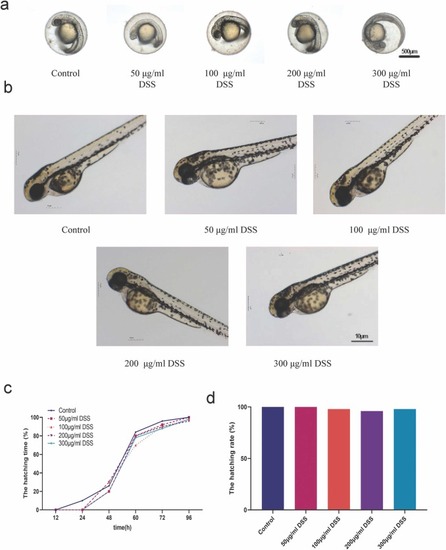
No significant phenotypic abnormalities were observed in zebrafish following treatment with Danggui Shaoyao San (DSS). a: The status of fertilized eggs after 1 day of intervention with DSS; b: The status of fertilized eggs after 5 days of intervention with DSS; c: The hatching time of fertilized eggs following DSS intervention; d: The hatching rate of fertilized eggs after DSS intervention, N = 10. |
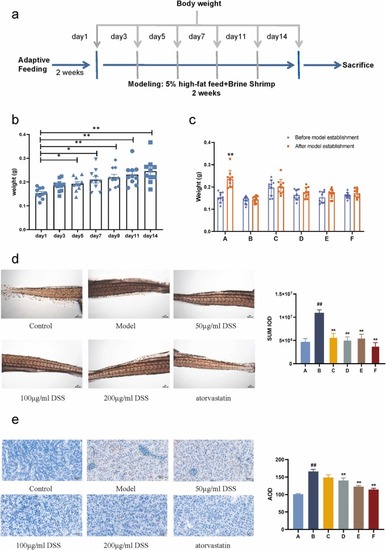
Danggui Shaoyao San reduces lipid deposition in a hyperlipidemic zebrafish model. a: Flowchart illustrating the establishment of the hyperlipidemia model; b: Alterations in zebrafish body weight following high-fat diet feeding. Compared with the control group, * P < 0.05, * * P < 0.01, N = 10; c: Changes in zebrafish body weight before and after the induction of hyperlipidemia. Compared with the model group, * * P < 0.01, N = 10; d: Oil Red O staining results of tail vessels of larval fish. Compared with the model group, * * P < 0.01, N = 8; e: Oil Red O staining results of the liver of adult fish. Compared with the model group, * * P < 0.01, N = 3; A: the control group; B: the model group; C: the 50 μg/ml DSS group; D: the 100 μg/ml DSS group; E: the 200 μg/ml DSS group; F: the atorvastatin group. |
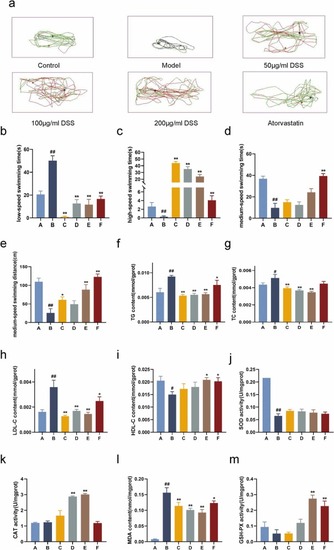
Danggui Shaoyao San can enhance locomotor activity and regulate lipid metabolism in a zebrafish hyperlipidemia model. a: Swimming trajectory of zebrafish. b: Statistical analysis of low-speed swimming time. c: Statistical analysis of high-speed swimming time. d: Statistical analysis of medium-speed swimming time. e: Statistical analysis of the medium-speed swimming distance; TG (f), TC (g), LDL-C (h), HDL-C (i), SOD (j), CAT (k), MDA (l), and GSH-PX (m) contents in the liver tissue of adult zebrafish. A: the control group; B: the model group; C: the 50 μg/ml DSS group; D: the 100 μg/ml DSS group; E: the 200 μg/ml DSS group; F: the atorvastatin group. Compared with the model group, * P < 0.05, * * P < 0.01, N = 6. |
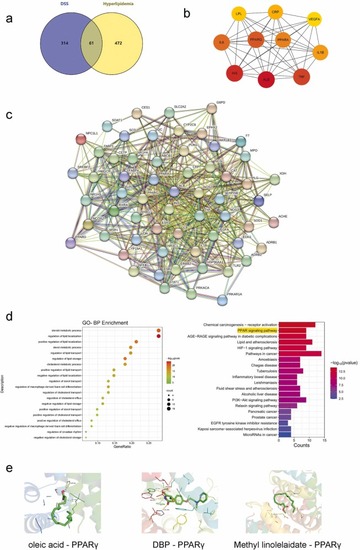
Network pharmacology analysis of Danggui Shaoyao San in the treatment of hyperlipidemia. a: Predictive Venn diagram of potential targets of Danggui Shaoyao San against hyperlipidemia; b: PPI network of hub genes involved in lipid metabolism; c: PPI network of the target genes for treating hyperlipidemia with Danggui Shaoyao San; d: Enrichment pathway maps for GO analysis and KEGG analysis of Danggui Shaoyao San; e: Molecular docking results. |
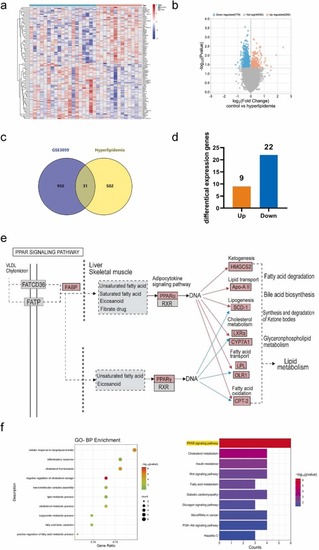
GEO analysis of clinical datasets for hyperlipidemia. a: Heatmap of DEGs in the GSE3059 dataset; b: Volcano plot depicting the differential gene expression in the GSE3059 dataset; c: Venny map of GSE3059 targets and core targets of hyperlipidemia; d: Upregulation and downregulation status of the intersecting genes; e: Pathway diagram of the PPAR signaling pathway; f: GO analysis and KEGG analysis enrichment pathway map. |
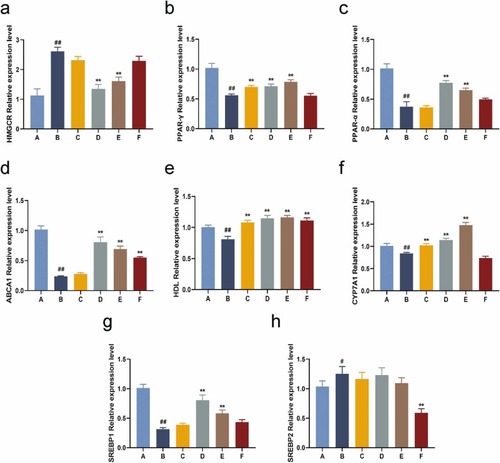
Danggui Shaoyao San regulates the expression of genes associated with the PPAR signaling pathway in the zebrafish hyperlipidemia model. a: The mRNA expression level of HMGCR; b: The mRNA expression level of PPARγ; c: The mRNA expression level of PPARα; d: The mRNA expression level of ABCA1; e: The mRNA expression level of HDL; f: The mRNA expression level of CYP7A1; g: The mRNA expression level of SREBP1; h: The mRNA expression level of SREBP2; A: the control group; B: the model group; C: the 50 μg/ml DSS group; D: the 100 μg/ml DSS group; E: the 200 μg/ml DSS group; F: the atorvastatin group; Compared with the model group, * * P < 0.01, N = 15. |
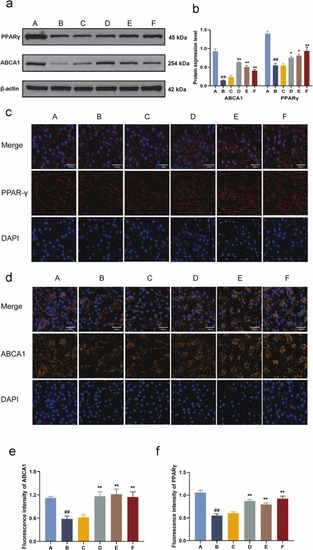
Danggui Shaoyao San upregulates PPARγ and ABCA1 proteins in the liver of the zebrafish hyperlipidemia model. a: Western blotting for PPARγ and ABCA1; b: Statistics of relative PPARγ and ABCA1 protein expression; c-d: Immunofluorescence (IF) for PPARγ and ABCA1; e-f: Fluorescence intensity of PPARγ and ABCA1. A: the control group; B: the model group; C: the 50 μg/ml DSS group; D: the 100 μg/ml DSS group; E: the 200 μg/ml DSS group; F: the atorvastatin group; Compared with the control group, ##P < 0.01; Compared with the model group, * P < 0.05, * * P < 0.01, N = 3. |

The mechanism by which Danggui Shaoyao San improves hyperlipidemia by regulating the PPAR signaling pathway. |
|