
|
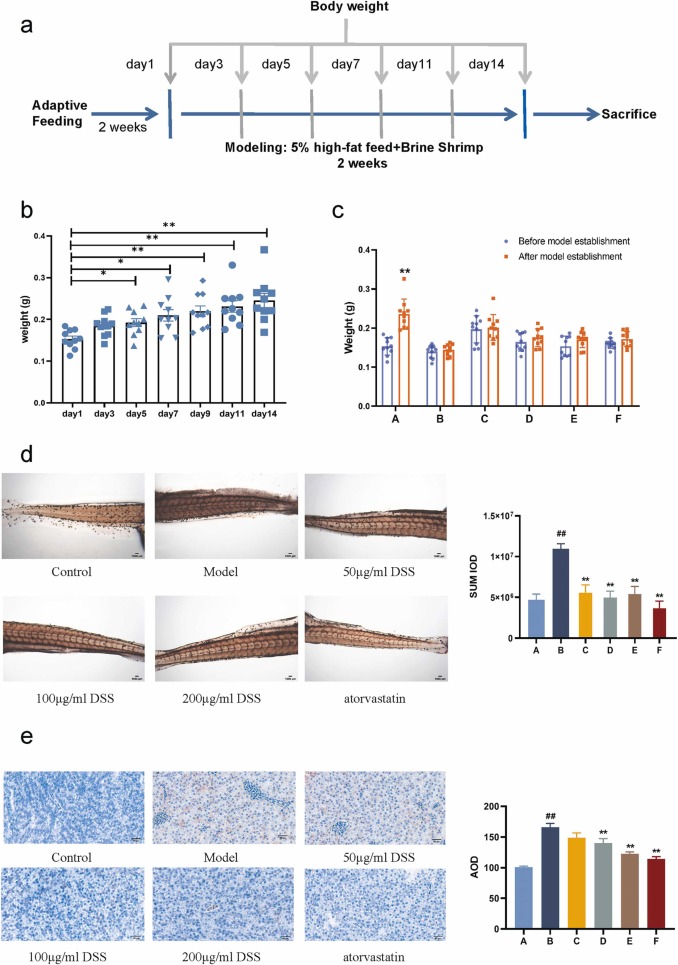
Fig. 3 Danggui Shaoyao San reduces lipid deposition in a hyperlipidemic zebrafish model. a: Flowchart illustrating the establishment of the hyperlipidemia model; b: Alterations in zebrafish body weight following high-fat diet feeding. Compared with the control group, * P < 0.05, * * P < 0.01, N = 10; c: Changes in zebrafish body weight before and after the induction of hyperlipidemia. Compared with the model group, * * P < 0.01, N = 10; d: Oil Red O staining results of tail vessels of larval fish. Compared with the model group, * * P < 0.01, N = 8; e: Oil Red O staining results of the liver of adult fish. Compared with the model group, * * P < 0.01, N = 3; A: the control group; B: the model group; C: the 50 μg/ml DSS group; D: the 100 μg/ml DSS group; E: the 200 μg/ml DSS group; F: the atorvastatin group.