
Image
|
Figure Caption
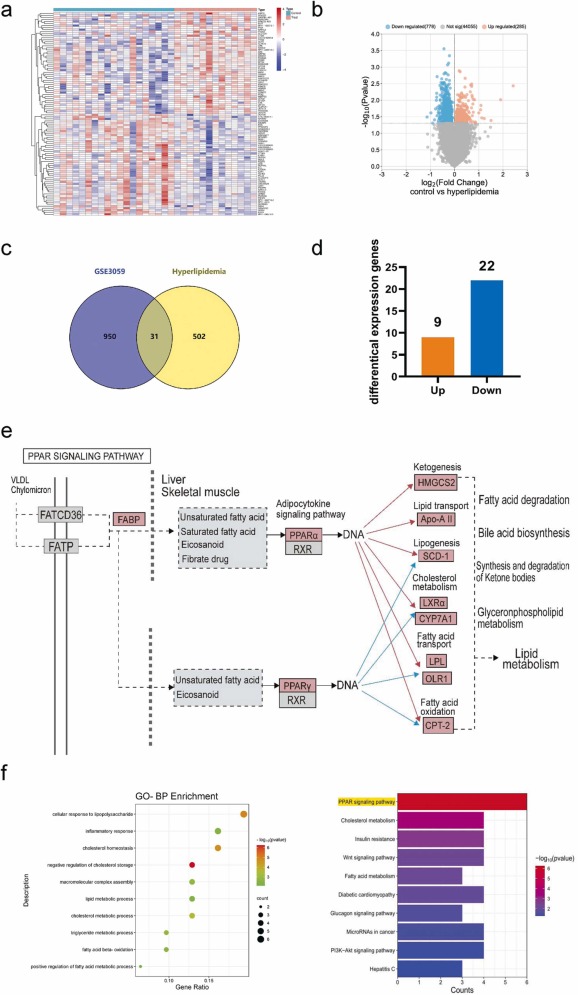
Fig. 6 GEO analysis of clinical datasets for hyperlipidemia. a: Heatmap of DEGs in the GSE3059 dataset; b: Volcano plot depicting the differential gene expression in the GSE3059 dataset; c: Venny map of GSE3059 targets and core targets of hyperlipidemia; d: Upregulation and downregulation status of the intersecting genes; e: Pathway diagram of the PPAR signaling pathway; f: GO analysis and KEGG analysis enrichment pathway map.
Acknowledgments
This image is the copyrighted work of the attributed author or publisher, and
ZFIN has permission only to display this image to its users.
Additional permissions should be obtained from the applicable author or publisher of the image.
Full text @ Biomed. Pharmacother.