FIGURE SUMMARY
Title

Disrupting the Repeat Domain of Premelanosome Protein (PMEL) Produces Dysamyloidosis and Dystrophic Ocular Pigment Reflective of Pigmentary Glaucoma

Authors
Hodges, E.D., Chrystal, P.W., Footz, T., Doucette, L.P., Noel, N.C.L., Li, Z., Walter, M.A., Allison, W.T.
Source
Full text @ Int. J. Mol. Sci.

ZFIN is incorporating published figure images and captions as part of an ongoing project. Figures from some publications have not yet been curated, or are not available for display because of copyright restrictions.

Human PMEL is engulfed by trabecular meshwork cells, providing a potential route for pigment cell defects to influence ocular drainage and glaucomatous increases in intraocular pressure. However, our surface-level phenotyping of TM-1 cell health did not reveal any overt toxicity to the cells engulfing patient variant PMEL; further work is warranted before any confident interpretations about the lack of toxicity or functional disruption can be concluded. (A) Schematic of human PMEL protein (in sync with Figure 2A), detailing the identity of pigmentary glaucoma patient variants. Details of the repeat region are simplified/omitted here, but they are presented in Figure S1. PMEL processing via cleavages produces bands Mα, Mβ and P1, with the latter two being detectable by a C-terminal V5 tag. Symbols * and ∆ indicate positions of pigmentary glaucoma patient variants, including an enrichment of missense mutations in the repeat domain. (B) SKMEL5 cells were edited with CRISPR to knockout (KO) endogenous PMEL, generating clone SK5PA04 that showed a lack of PMEL when immunoblotted with anti-PMEL antibody HMB45. (C) Patient variant PMEL with V5 tag was transfected into SK5PA04 cells and blotted with V5 antibody. (D) Trabecular meshwork cells (TM-1) engulfed PMEL (V5-tagged) supplied by conditioned media from transfected SK5PA04 cells; notice the lack of signal in TM-1 cells incubated with conditioned media from SK5PA04 cells with empty vector. Engulfment of patient variant PMEL did not lead to a detectable reduction in cell viability, but further work would be needed to assess long-term health and function of these TM cells, perhaps including the use of in vivo platforms.

A zebrafish model of pigmentary glaucoma engineered via subtle mutation to the repeat region of the PMEL homolog that forms functional amyloid in pigment cells. (A) Homologs of PMEL protein in human and zebrafish are strikingly similar with a full complement of shared domains, including a repeat domain that contributes to making functional amyloid. Zebrafish Pmela protein is ~25% longer than human PMEL. The repeat domain in PMEL is homologous between human and zebrafish, though the details of which amino acids comprise each repeat are different; colours in panels (AC) present a simplified schematic of amino acid properties (polarity) in these repeats, with detailed views in panel F and Figure S1. Symbols * and ∆ above human PMEL indicate positions of pigmentary glaucoma patient variants (details in Figure 1), including an enrichment of missense mutations in the repeat domain [1]. (A) Previously engineered zebrafish mutant pmelaua5022 creates a premature stop codon in the N-terminus of zebrafish Pmela, and this is a null allele likely due in part to nonsense-mediated decay [1]. (B,C) Human vs. zebrafish repeat domains (simplified to emphasize repetitive aspects; see Figure S1 for details of exact amino acid content). Here, we engineered a zebrafish mutant ua5030 with an in-frame 12 bp deletion leading to a predicted loss of only 4 residues (“del 4aa”). Panel (C) presents the same protein sequences as panel B but reconfigured to emphasize the repetitive nature of the PMEL repeat domain. Human PMEL contains 5 repeats of 26 amino acids (C), in comparison to zebrafish Pmela (C’), which has 7 repeats of 22 amino acids. Akin to the non-synonymous mutations in pigmentary glaucoma patients (*), the deletion in Pmelaua5030 (C”) is predicted to subtly disrupt the overall protein but alter residues that show a rigidly repetitive character. (D) Pigment defect in larval pmela mutant zebrafish. Dorsal view, anterior at top, merge of wildtype (WT) and mutant larvae to allow side-by-side comparison at dorsal midline (dotted line). (E) Homozygous zebrafish pmela mutant larvae lacked detectable Pmela protein (both alleles). Pmela abundance was perhaps reduced in heterozygous pmela+/ua5022 but appeared similar to WT in heterozygous pmela+/ua5030 larvae. Custom Anti-Pmela antibody was raised against the repeat domain of zebrafish Pmela. (F) Zebrafish Pmela repeat region (NP_001038795.1 residues 377-529) with amino acid properties colour-coded by polarity and stacked to emphasize the rigidity of repeat identity (repeats R1 to R7 are listed alongside their residue numbering). Mutation pmelaua5030 deletes 12 bp to create a 4-residue in-frame deletion. SP = signal peptide; NTR = N-terminal region; CAF = core amyloid fragment; PKD = polycystic kidney domain; KLD = Kringle-like domain; TM = transmembrane domain.

pmela mutants display systemic hypopigmentation and retarded eye size development. (A) Both pmela mutant alleles present with systemic hypopigmentation in homozygotes at 3 days post-fertilization (dpf). (B) Adult homozygous ua5030 zebrafish (−/−, top) display hypopigmentation when compared to heterozygous and wildtype fish. (C,D) Microphthalmia is observed in homozygous mutants from both alleles beginning by 4 dpf (days post-fertilization). Heterozygous pmela+/ua5022 larvae show normal eye size, whereas heterozygous pmela+/ua5030 larvae have reduced eye size. Considering the normal abundance of Pmela in pmela+/ua5030 larvae (Figure 2E), this appears to be a dominant phenotype rather than haploinsufficiency.

Adult pmela−/− mutants presented no measurable phenotypes when evaluated via rebound tonometry and ocular computed tomography (OCT). (A,B) No consistent difference in intraocular pressure (IOP) was apparent among adult zebrafish of various pmela genotypes. IOP was measured in adult zebrafish using Tonovet plus. Average readings for each fish are plotted. A Kruskal–Wallis statistical test showed no significant differences between means. (CF) Retinal lamination and layer depths showed no overt alterations when pmela mutants were assessed in vivo via OCT. Exemplar images are shown for adult wildtype and ua5030 homozygotes, whereas ua5022 homozygotes and measurements of additional layers are reported in Figures S3 and S4. The ratio of each retinal layer was normalized to the full retinal depth (RD) for each fish. RPE, retinal pigment epithelium; PL, photoreceptor layer; ONL, outer nuclear layer; INL, inner nuclear layer; IPL, inner plexiform layer; NFL, neurofibrillary layer. Comparison with age-matched controls used Mann–Whitney statistical tests. The horizontal lines in the graphs B, E and F represent the mean values of multiple fish and the value for each individual fish is plotted as a filled symbol (circle, square, rectangle, diamond, etc.).

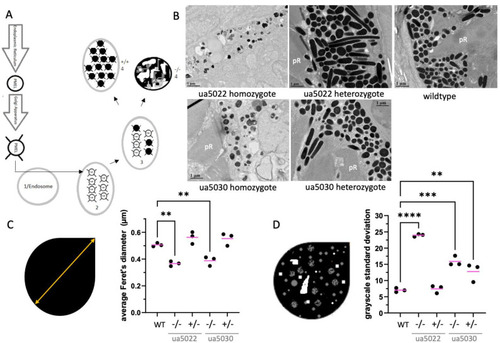
The repeat region of the Pmela protein is required for the elongation of melanosomes and the even distribution of melanin within melanosomes. (A) Schematic of the maturation of premelanosome protein (Pmel) and the melanosome. Pmel is made in the endoplasmic reticulum and modified in the Golgi apparatus before entering an endosome. The endosome then goes through four stages (1 → 4) of maturation before becoming a fully formed (WT) melanosome. Stage 1: fibril-free endosome; Stage 2: fibrils begin forming; Stage 3: melanin starts to be deposited on the fibrils; Stage 4: melanin is evenly distributed, obscuring the fibrils. Melanosomes are oblong in shape (WT). In Pmel-knockout mice (−/−), the mature melanosome has irregularly distributed melanin and is round like in Stage 1 [18]. (B) Sample transmission electron microscopy images of retinas from 5-day post-fertilization zebrafish of various pmela genotypes: wildtype, ua5022 homozygous and heterozygous, and ua5030 homozygous and heterozygous. pR = photoreceptor. (C) A pictograph of measuring Feret’s diameter (orange arrow—the longest distance that could be measured in a straight line within the confines of the melanosome) accompanies the results from the different genotypes; the ANOVA with Tukey’s post hoc test shows the average Feret’s diameter of melanosomes is shorter in the two homozygote mutants, ua5022 and ua5030, when compared to that of the wildtype. (D) Melanin deposition is uneven in several pmela genotypes. The average grayscale value is measured by pixels within single melanosomes, and the grayscale standard deviation is calculated on individual melanosomes. This standard deviation is used as a metric for general variation within all the melanosomes of an individual. Wildtype melanosomes are homogenous with low standard deviation; in contrast, mutants have variable electron density due to unequal distribution (clumping) within the melanosomes. An ANOVA with Tukey’s post hoc test shows the melanin deposition in melanosomes (average grayscale standard deviation) is more variable in ua5022 homozygotes, and in both ua5030 homozygotes and heterozygotes. ** p < 0.01, *** p < 0.001; **** p < 0.0001. See Supplemental Figure S5 for individual melanosome data.

Summary of pmela genotype–phenotype relations and illustrations suggesting how the heterozygous ua5030 phenotype might be attributed to aberrant fibril formation and melanin deposition. (A) The linear wildtype (WT) peptide has a subset of residues colour-coded for their biochemical properties, akin to Figure 2. There are seven repeated modules. We assume a small conformational change (details unknown) at the location of the 4-residue deletion (Δ4aa, blue arrow), represented here by the absence of a slight bend in the peptide shape at the C-terminal repeat. (B) Homozygous mutant Pmela can stack together effectively (akin to WT), where the mutant is disrupted (e.g., 4 residues shorter) consistent with lost function (abundance of this protein is low in homozygous mutants). In heterozygous PmelaWT/ua5030 fish, the melanosome has a mixture of two different peptides that try to assemble, and the stacking is disrupted (apparent on right side of the stack). Top half of the heterozygous stack imagines a 1:1 ratio and exactly reiterated WT/mutant/WT/mutant peptides, and bottom of stack imagines a more random recruitment of WT vs. mutant peptides. This is meant to represent how the intermolecular interaction of PMEL variants might be impactful in the heterozygous state (disrupting melanin pigment deposition and melanosome shape), consistent with a dominant inheritance. Imagine each stack is extended top and bottom to make a fibril, and fibrils then form a scaffold for both melanin deposition and melanosome morphogenesis. This simplified schematic ignores various details of PMEL biochemistry. (C) Summary of how pigmentation phenotypes differ in various disruptions. Repeat domain (RPT) presented as a box, protein schematic summarizes the different phenotypes using gray colouration for hypomorphs or null mutations, and truncations in fdv are schematized shorter. The legend shows the various changes to the photoreceptors and retinal pigmented epithelium: see text and previously published works [1,19,20]. Near-absence of Pmela or loss-of-function mutation produces pigment phenotypes, but moderately reduced abundance of Pmela does not. Phenotypes in ua5030 heterozygotes are consistent with an altered RPT domain leading to dominant inheritance of pigmentation deficits.

Acknowledgments
This image is the copyrighted work of the attributed author or publisher, and ZFIN has permission only to display this image to its users. Additional permissions should be obtained from the applicable author or publisher of the image. Full text @ Int. J. Mol. Sci.