FIGURE SUMMARY
Title

Osteomodulin downregulation is associated with osteoarthritis development

Authors
Zappia, J., Tong, Q., Van der Cruyssen, R., Cornelis, F.M.F., Lambert, C., Pinto Coelho, T., Grisart, J., Kague, E., Lories, R.J., Muller, M., Elewaut, D., Hammond, C.L., Sanchez, C., Henrotin, Y.
Source
Full text @ Bone Res

Localization of OMD in the murine knee joint. a Immunostaining of OMD (in brown) in the knee joint (medial tibial plateau) of KO, WT, and UP male mice at 4, 8, and 16 months. Scale bar = 100 µm. Zoom on specific areas from WT of 16 months. Scale bar = 25 µm for (b) and 50 µm for (c, d). Representative pictures with n = 3 for each group. b Uncalcified articular cartilage (ac) and calcified cartilage (cc), separated by the tidemark (td—dotted line); chondrocytes (arrowheads). c Subchondral bone (sb), growth plate (gp) and lining cells (lc). d Metaphysis of the tibia showing the cortical bone (cb), the outer medial tibial side and the inner tibial side facing the bone marrow are indicated with (*)

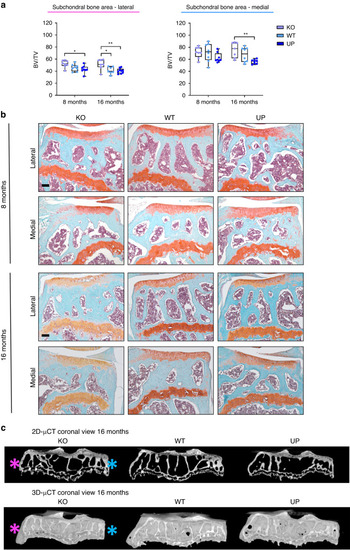
Histomorphometry of the cartilage was performed with QuPath at 4, 8, and 16 months. Knee joints of male mice were stained with Toluidine blue and areas corresponding to the total cartilage, the calcified cartilage, and the growth plate were measured for the medial tibial plateau and the lateral tibial plateau. a Measures of the growth plate area of both medial and lateral tibial plateaus were plotted to display the evolution of the growth plate over time with n = 13 for the KO, n = 16 for the WT and UP at 4 months; n = 16 for the KO and WT, and n = 15 for the UP at 8 months; n = 16 for the KO, n = 14 for the WT and n = 18 for the UP at 16 months. b Toluidine blue of the growth plate for the KO and the WT at 16 months are represented. Scale bar = 100 µm. c, e The thickness of the calcified cartilage was measured on the medial and lateral plateaus from the tibia. d, f The ratio between the calcified cartilage and the total cartilage two was reported for both the medial and lateral plateaus. For the medial plateau (c, d): n = 7 for the KO, n = 8 for the WT and UP at 4 months; n = 8 for the KO and WT and n = 7 for the UP at 8 months; n = 8 for the KO, n = 7 for the WT and n = 9 for the UP at 16 months. For the lateral plateau (e, f): n = 7 for the KO, n = 8 for the WT and UP at 4 months; n = 8 for each genotype at 8 months; n = 8 for the KO, n = 7 for the WT and n = 9 for the UP at 16 months. Two-way ANOVA was performed to evaluate the genotype effect (in black) and the time effect inside a genotype (in the corresponding color). The data were plotted as a box plot showing all points with differences being considered significant at P values <0.05 (*P < 0.05, **P ≤ 0.01, ***P ≤ 0.001, ****P ≤ 0.000 1)

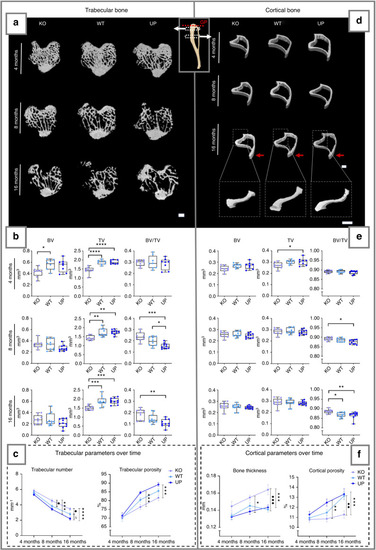
µCT analysis of the metaphysis of the tibia of the male mice at 4, 8 and 16 months. The trabecular bone (left) and the cortical bone (right) were analyzed separately. Regions measured for the trabecular bone and cortical bone are illustrated on the schematic tibia with the growth plate (GP), marked with a red dotted line, used as a reference for their selection. a, d The 3D rendering of each genotype is represented with a scale bar of 500 µm. Red arrows indicate the tibial crest on the 16 months cortical bone. The zoom on the 16 months cortical bone illustrates the lateral side of the tibia with a scale bar of 500 µm. b, e The bone parameters measured for the trabecular and cortical bone were the bone volume (BV); the total volume (TV) and their ratio (BV/TV). The data were plotted as a box plot showing all points. One-way ANOVA was performed with differences being considered significant at P values <0.05 (*P < 0.05, **P ≤ 0.01, ***P ≤ 0.001, ****P ≤ 0.000 1). c, f The trabecular number, trabecular porosity, cortical thickness, and cortical porosity are represented over time. At 4 months: n = 8 for each genotype; at 8 months: n = 8 for the KO, n = 10 for the WT and UP; at 16 months: n = 9 for the KO, n = 11 for the WT, and n = 10 for the UP. Two-way ANOVA was performed on the analysis over time with error bars representing ± SEM and differences being considered significant at P values <0.05, * represents significant differences between the KO and the UP, ♦ represents significant differences between the KO and the WT and Δ represents significant differences between the WT and the UP (*/♦/ΔP < 0.05, **/♦♦/ΔΔP ≤ 0.01, ***/♦♦♦P ≤ 0.001)

Effect of Omd on the spontaneous development of subchondral bone sclerosis. a Histomorphometry of the subchondral bone on Safranin-O Fast Green of the knee joint of male mice at 8 and 16 months was performed with QuPath on the lateral and medial plateaus of the tibia separately. At 8 months: n = 8 for each genotype; at 16 months: n = 7 for the KO, n = 7 for the WT, and n = 9 for the UP. The data were plotted as a box plot showing all points. Two-way ANOVA was performed with differences being considered significant at P values <0.05 (*P < 0.05, **P ≤ 0.01). b Representative picture of the Safranin-O Fast Green of the knee joint of male mice showing the subchondral bone area for the lateral and medial plateaus of the tibia separately. Scale bar = 100 µm. c µCT of the subchondral bone of the tibia of the mice at 16 months. The pink asterisk indicates the lateral plateau and the blue asterisk indicates the medial plateau

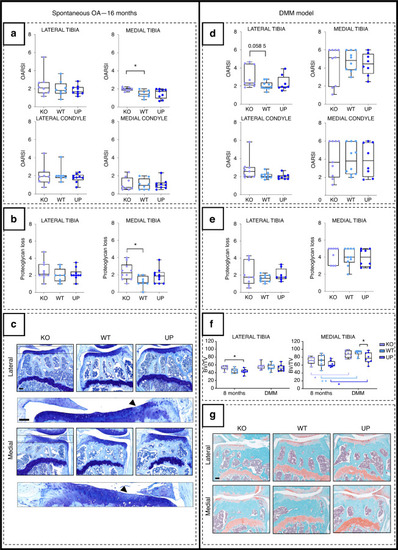
Analysis of the development of OA lesions in the different genotypes after spontaneously occurring with age (left) or after the DMM (right). The spontaneous OA lesions were considered in the 16-month-old male mice and the DMM was performed on 16-week-old male mice and they were stopped at 28 weeks. a, d The cartilage degradation was assessed with the OARSI score (from 0 to 6) according to the OARSI recommendations. The score was attributed to the lateral and the medial tibial plateaus and to the lateral and medial condyles for the spontaneous model and the DMM model. b, e The score of the loss of proteoglycan (from 0 to 5) was assessed according to the OARSI recommendations for the lateral and medial tibial plateaus for the spontaneous model and the DMM model. For the OARSI score of the 16-month-old mice: n = 8 for the KO and the WT and n = 9 for the UP and for the loss of proteoglycan n = 10 for the KO, n = 8 for the WT and n = 10 for the UP. For the DMM model: n = 9 for the KO, n = 10 for the WT, and n = 8 for the UP. One-way ANOVA was performed with differences being considered significant at P values <0.05 (*P < 0.05). c Illustrations of the lateral and medial plateaus stained with Toluidine blue of the 16-month-old mice with zooms on proteoglycan loss issued from the KO and indicated by the arrowhead. Scale bar = 100 µm. f Histomorphometry of the subchondral bone on Safranin-O Fast Green of the knee joint of the DMM mice was performed with QuPath on the medial and lateral plateaus separately. Each genotype was compared to a similar age group of 8-month-old mice. At 8 months: n = 8 for each genotype; for the DMM: n = 9 for the KO, n = 10 for the WT, and n = 8 for the UP. The data were plotted as a box plot showing all points. Two-way ANOVA was performed with differences being considered significant at P values <0.05 (*P < 0.05, **P ≤ 0.01). g Illustrations of the lateral and medial plateaus stained with Safranin-O Fast Green in the DMM. Scale bar = 100 µm

Analysis of the gait of 4-, 8-, and 16-month-old male mice with the CatWalk XT. The intensity corresponds to the mean intensity at the maximum paw contact normalized with the mean of the maximum contact paw area, the speed, and the weight of the mouse. At 4 months: n = 8 for each genotype; at 8 months n = 8 for each genotype; at 16 months: n = 14 for the KO, n = 12 for the WT and n = 10 for the UP. The data were plotted as a box plot showing all points. One-way ANOVA was performed when the distribution was Gaussian and Kruskal–Wallis was performed when the distribution was not Gaussian with differences being considered significant at P values <0.05 (*P < 0.05, **P ≤ 0.01, ***P ≤ 0.001)

The mutant deficient for omd was generated through CRISPR/Cas 9. a Histology of the jaw joint was performed on 1-year-old zebrafish. The OARSI score of the palatoquadrate was attributed to the jaw joint stained with Toluidine blue with n = 4 for the WT and the mutant. The data were plotted as a box plot showing all points. Mann–Whitney test was performed with differences being considered significant at P values <0.05 (*P < 0.05). Scale bar = 200 µm. b The mutant line was crossed with the Tg(ctsk:Citrine) for the osteoclasts analysis during the caudal fin regeneration. The caudal fin of 1-year-old zebrafish was cut and the regenerating fin was observed after 7 days. The osteoclasts are represented in yellow-green from the ctsk:Citrine signal and the mineralized ray were stained with Alizarin red. The data were plotted as a box plot showing all points. The pixel intensity of the regenerating rays is plotted and normalized by the background intensity with n = 14 for the WT and n = 16 for the mutant from two independent experiments which were pooled to perform the unpaired Student’s t test with differences being considered significant at P values <0.05 (**P ≤ 0.01). Scale bar = 200 µm. c TRAP staining was performed on the elasmoid scales of 1.6-year-old zebrafish. The TRAP staining area was normalized with the total scale area. The TRAP staining and the circularity of the scales were assessed with ZFBONE—Fiji with n = 5 for the WT and the mutant and with 6 to 15 scales/zebrafish analyzed. Scale bar = 0.2 mm. The data were plotted as a box plot showing all points. Unpaired Student’s t test with differences being considered significant at P values <0.05 (*P < 0.05, **P ≤ 0.01)

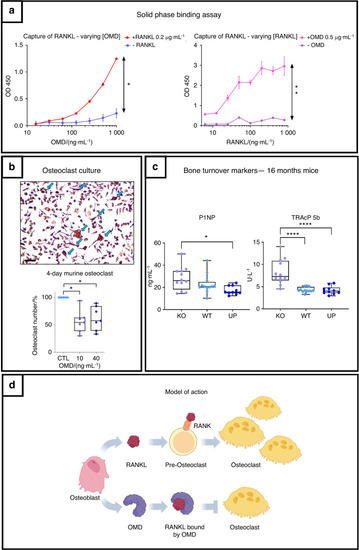
OMD inhibits osteoclastogenesis through its direct interaction with RANKL and balances bone remodeling. a Solid phase binding assay on the capture of RANKL by OMD. RANKL was coated on a plate followed by OMD addition. On the left: Binding assay with different concentrations of OMD (1 000 to 15.65 ng·mL−1 by serial 2X dilution), with 0.2 μg·mL−1 of coated RANKL (red curve) and negative control without RANKL (blue curve). On the right: Binding assay with different concentrations of coated RANKL (800 to 6.25 ng·mL−1) and 0.5 μg·mL−1 of given OMD (pink curve); negative control without OMD (purple curve). Wilcoxon test was performed with differences being considered significant at P values < 0.05 (*P < 0.05, **P ≤ 0.01). b Assay of the effect of OMD on primary murine osteoclast culture. The peripheral blood mononuclear cells were collected from murine bone marrow and differentiated into osteoclasts with M-CSF and RANKL. Osteoclasts were counted after 4 days of differentiation following a TRAP staining. Each point represents a mouse, n = 7. The osteoclast count was represented in percentage of cells with the corresponding control set as 100%. Blue arrows point at osteoclasts. Scale bar = 50 µm. The data were plotted as a box plot showing all points. One-way ANOVA was performed with differences being considered significant at P values <0.05 (*P < 0.05). c Level of P1NP and TRAcP 5b measured in the serum of KO, WT and UP mice. The data were plotted as a box plot showing all points with n = 12 for the KO and WT, and n = 10 for the UP. One-way ANOVA was performed when the distribution was Gaussian and Kruskal–Wallis was performed when the distribution was not Gaussian with differences being considered significant at P values < 0.05 (*P < 0.05, **P ≤ 0.01, ****P ≤ 0.000 1). d Schematic representation of the mechanism of OMD on osteoclastogenesis. Osteoblasts secrete RANKL which binds to the RANK receptor on the membrane of pre-osteoclasts to induce their differentiation into osteoclasts. In parallel, osteoblasts also secrete OMD which displays the ability to capture RANKL and would prevent its binding to RANK

Acknowledgments
This image is the copyrighted work of the attributed author or publisher, and ZFIN has permission only to display this image to its users. Additional permissions should be obtained from the applicable author or publisher of the image. Full text @ Bone Res