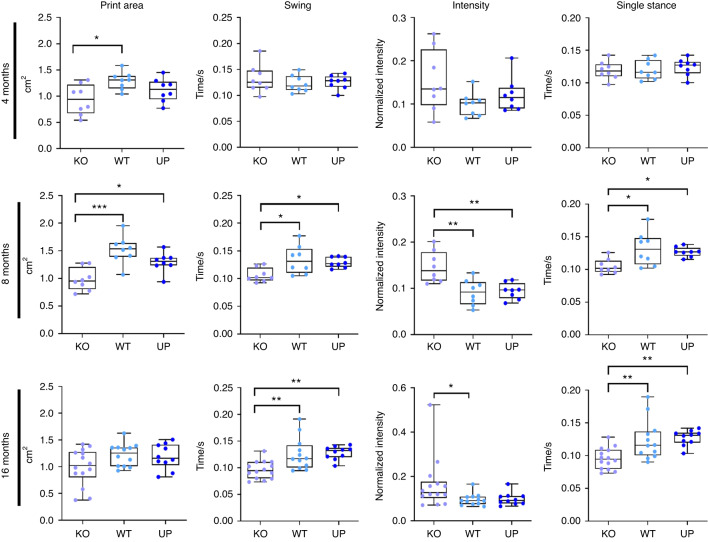
IMAGE

Fig. 6

ID
ZDB-IMAGE-231002-215
Source
Figures for Zappia et al., 2023
Image
Figure Caption

Fig. 6

Analysis of the gait of 4-, 8-, and 16-month-old male mice with the CatWalk XT. The intensity corresponds to the mean intensity at the maximum paw contact normalized with the mean of the maximum contact paw area, the speed, and the weight of the mouse. At 4 months: n = 8 for each genotype; at 8 months n = 8 for each genotype; at 16 months: n = 14 for the KO, n = 12 for the WT and n = 10 for the UP. The data were plotted as a box plot showing all points. One-way ANOVA was performed when the distribution was Gaussian and Kruskal–Wallis was performed when the distribution was not Gaussian with differences being considered significant at P values <0.05 (*P < 0.05, **P ≤ 0.01, ***P ≤ 0.001)

Acknowledgments
This image is the copyrighted work of the attributed author or publisher, and ZFIN has permission only to display this image to its users. Additional permissions should be obtained from the applicable author or publisher of the image. Full text @ Bone Res