
- Title
-
Lethal and sublethal effects towards zebrafish larvae of microcystins and other cyanopeptides produced by cyanobacteria
- Authors
- Torres, M.A., Jones, M.R., Vom Berg, C., Pinto, E., Janssen, E.M.
- Source
- Full text @ Aquat. Toxicol.
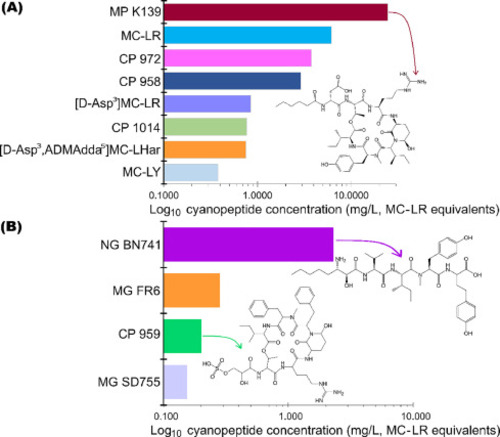
Concentration of cyanopeptides produced by (A) Microcystis panniformis MIRS-04 and (B) Microcystis aeruginosa NPCD-01, expressed as mg/L of MC-LR equivalents (i.e. based on using MC-LR external calibration curve for quantification). Values reflect the highest exposure concentration employed in the toxicity tests of the pooled extract for micropeptins (MP), microcystins (MC), cyanopeptolins (CP), nostoginin (NG) and microginins (MG). |
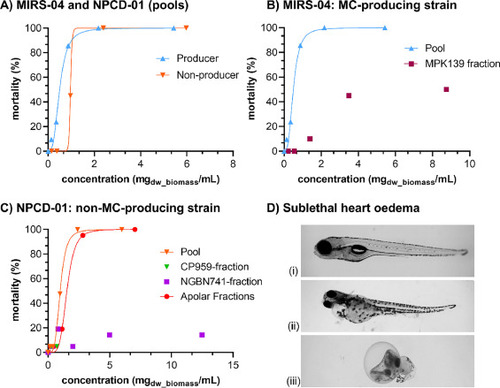
Dose-response mortality curves of zebrafish larvae relative to mg dry biomass equivalents (mgdw_biomass/mL) at 120 hpf, following exposure to varying concentrations of (A) all pooled HPLC-fractions of MIRS-04 (blue up-triangles) and NPCD-01 (orange down-triangles); (B) a pool of all HPLC fractions from MIRS-04 (blue up-triangles) and the specific HPLC fraction from MIRS-04 containing primarily micropeptin K139 (dark-red squares); (C) a pool of all HPLC fractions from NPCD-01 and the individual HPLC fractions from NPCD-01 containing mainly nostoginin-BN741 (purple squares), cyanopeptolin-959 (green down-triangles) and apolar compounds (‘apolar fractions’; red circles); and (D) microscope images (x3 magnification) of a healthy zebrafish larvae from the control wells (i) versus representative examples of larvae with heart oedema following exposure to MIRS-04 fraction #7 (micropeptin K139 at 18.32 mg/L, C1) (ii) and NPCD-01 fraction #3 (nostoginin-BN741 at 2.91 mg/L, C1) (iii). |
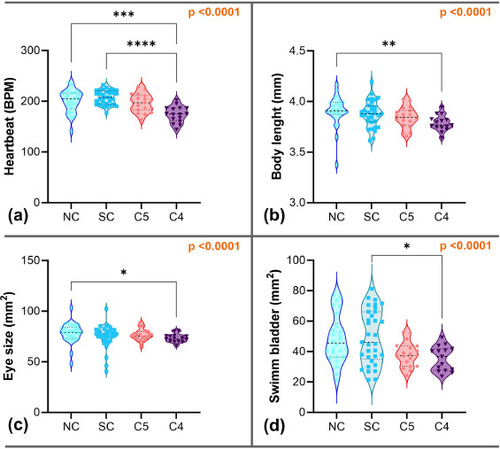
Heartbeat(a), body length (b), eye size (c), and swim bladder size (d) measured of surviving larvae exposed to MIRS-04 pooled fractions (120 hpf) at the second to lowest and lowest concentration levels tested (C4 = 0.35 mgdw/mL and C5 = 0.14 mgdw/mL, respectively) and for the negative control (NC) and the solvent control (SC). The p values reported refer to the Kruskal–Wallis one-way ANOVA. Significant alterations between groups in the post-hoc Dunn's for multiple comparisons are indicated by asterisks (*p < 0.05; **p < 0.01; ***p < 0.001; ****p < 0.0001). |

Time series of the accumulated distance moved, recorded every 30 s, and boxplots representing the average distance moved in each phase of the behaviour assay - spontaneous, light intervals, and dark intervals - of larvae exposed to different concentrations of MIRS-04 pooled fractions. On boxplots, alterations between groups obtained by Kruskal–Wallis one-way analysis of variance, followed by Dunn's multiple comparison test (95% confidence interval) are indicated by asterisks (*p < 0.05). NC: Negative control; SC: Solvent control, C4: 0.35 mgdw/mL; C5: 0.14 mgdw/mL. |