
|
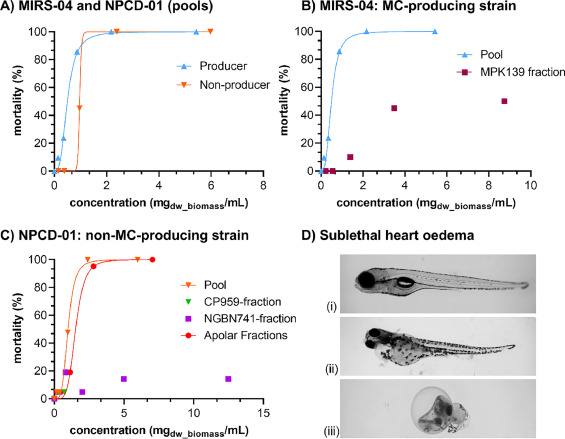
Fig. 2 Dose-response mortality curves of zebrafish larvae relative to mg dry biomass equivalents (mgdw_biomass/mL) at 120 hpf, following exposure to varying concentrations of (A) all pooled HPLC-fractions of MIRS-04 (blue up-triangles) and NPCD-01 (orange down-triangles); (B) a pool of all HPLC fractions from MIRS-04 (blue up-triangles) and the specific HPLC fraction from MIRS-04 containing primarily micropeptin K139 (dark-red squares); (C) a pool of all HPLC fractions from NPCD-01 and the individual HPLC fractions from NPCD-01 containing mainly nostoginin-BN741 (purple squares), cyanopeptolin-959 (green down-triangles) and apolar compounds (‘apolar fractions’; red circles); and (D) microscope images (x3 magnification) of a healthy zebrafish larvae from the control wells (i) versus representative examples of larvae with heart oedema following exposure to MIRS-04 fraction #7 (micropeptin K139 at 18.32 mg/L, C1) (ii) and NPCD-01 fraction #3 (nostoginin-BN741 at 2.91 mg/L, C1) (iii).