
Image
|
Figure Caption
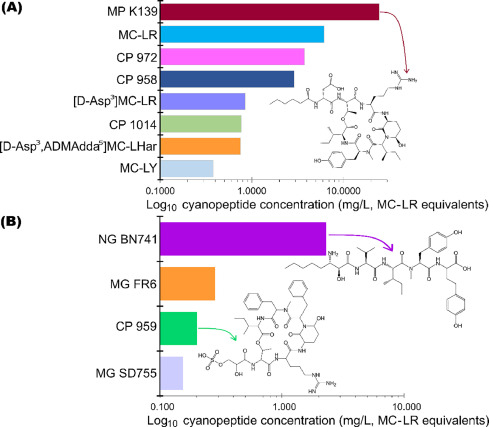
Fig. 1 Concentration of cyanopeptides produced by (A) Microcystis panniformis MIRS-04 and (B) Microcystis aeruginosa NPCD-01, expressed as mg/L of MC-LR equivalents (i.e. based on using MC-LR external calibration curve for quantification). Values reflect the highest exposure concentration employed in the toxicity tests of the pooled extract for micropeptins (MP), microcystins (MC), cyanopeptolins (CP), nostoginin (NG) and microginins (MG).
Acknowledgments
This image is the copyrighted work of the attributed author or publisher, and
ZFIN has permission only to display this image to its users.
Additional permissions should be obtained from the applicable author or publisher of the image.
Full text @ Aquat. Toxicol.