FIGURE SUMMARY
Title

Modulation of miR-146b Expression during Aging and the Impact of Physical Activity on Its Expression and Chondrogenic Progenitors

Authors
Dalle Carbonare, L., Minoia, A., Braggio, M., Bertacco, J., Piritore, F.C., Zouari, S., Vareschi, A., Elia, R., Vedovi, E., Scumà, C., Carlucci, M., Bhandary, L., Mottes, M., Romanelli, M.G., Valenti, M.T.
Source
Full text @ Int. J. Mol. Sci.

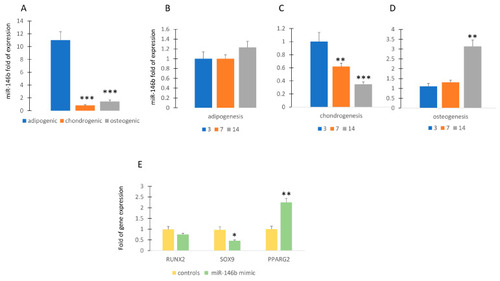
MiR-146b expression during differentiation. MiR-146b expression is higher in MSCs committed to adipogenic lineage compared to chondrogenic or osteogenic lineage (miR-146b expression in chondrogenic or osteogenic groups compared to adipogenic group) (
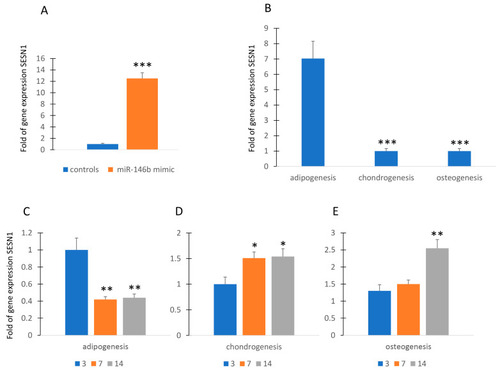
A). MiR-146b expression is poorly modulated during adipogenesis (miR-146b expression at 7 or 14 days of differentiation compared to 3 days of differentiation) (B) and highly modulated during chondrogenic (C) or osteogenic (D) differentiation. Forced expression of miR-146b induced the upregulation of PPARG2 and the downregulation of SOX9 (E). Data are shown as mean  ±  standard deviation (SD); * p < 0.05; ** p < 0.01; *** p < 0.005. For each experiment, six independent analyses were performed. In figure (BD), miR-146b expression at 7 or 14 days of differentiation is compared to that at 3 days of differentiation.

MiR-146b and SESTRIN. Forced expression of miR-146b increased SESN1 gene expression in MSCs (A). SESN1 is upregulated in adipogenic committed MSCs (B). SESN1 expression was downregulated during adipogenesis (C) and upregulated during chondrogenesis and osteogenesis (D,E). Data are shown as mean ± standard deviation (SD); * p < 0.05; ** p < 0.01; *** p < 0.005. For each experiment, six independent analyses were performed.

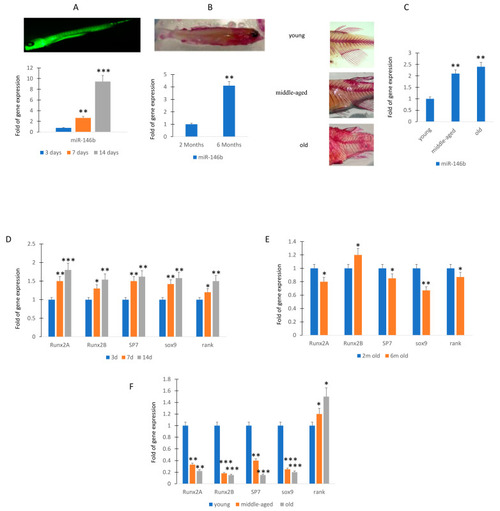
MiR-146b expression during zebrafish maturation. RT (real-time)-PCR analyses. MiR-146b expression after 3 (3d; sample n = 30), 7 (7d; sample n = 30), and 14 (14d; sample n = 30) days post fecundation (A). Expression levels of miR-146b at 2 (sample n = 30) and 6 months (sample n = 30) (B) and in young (sample n = 30), middle-aged (sample n = 30), and old zebrafish (sample n = 30) (C). Osteogenic (runxa, runxb, sp7), chondrogenic (sox9), and the receptor for RANK-Ligand gene expression increased during the maturation of larvae (D). Runx2a and sox9 gene expression was downregulated in 6 months compared to 2 months old zebrafish (E). Osteogenic or chondrogenic differentiation associated genes lowered in caudal fin during the aging (E). Rank gene expression, involved in osteoclast activation, was higher in the caudal fin of middle-aged and old zebrafish (F). Data are shown as mean ± standard deviation (SD); * p < 0.05; ** p < 0.01; *** p < 0.005. (A): Calcein staining of zebrafish at 14 days post fertilization. (B): Alizarin staining of zebrafish at 6 months of age. In particular, at 14dpf the miR-146b increased more than 8-fold compared to 3 dpf (A). Therefore, we evaluated the miR-146b expression in adult caudal fin of zebrafish, a model system for the evaluation of molecular mechanisms involved in regeneration [18]. In particular, miR-146b expression was evaluated in young (n = 30; 10–12 months), middle-aged (n = 30; 20–24 months), and old (n = 30; 30–36 months) zebrafish samples.

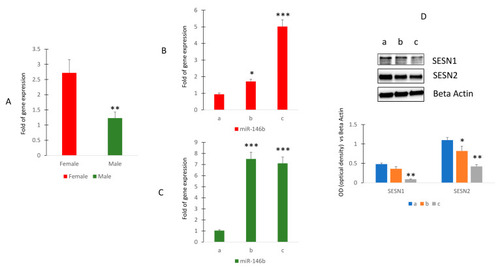
Circulating miR-146b expression in healthy human subjects. RT (real-time)-PCR in circulating miRNAs isolated from female (sample n = 12) and male (sample n = 17) (A) or in female (B) or in male (C) of different ages. Sestrin 1 and Sestrin 2 protein levels in MSCs cultured in presence of sera collected in women of different ages (D). (Median age: women 41.4 ± 7.2 ((group a (n = 4) 27.8 ± 1.9; group b (n = 4) 41.2 ± 1.9; group c (n = 4) 52.8 ± 0.8)); men 41.7 ± 9.7 ((group a (n = 5) 28.4 ± 1.1; group b (n = 6) 42.5 ± 0.8; group c (n = 6) 52.8 ± 0.63)). The original blots are presented in Supplementary S1. * p < 0.05; ** p < 0.01; *** p < 0.005.

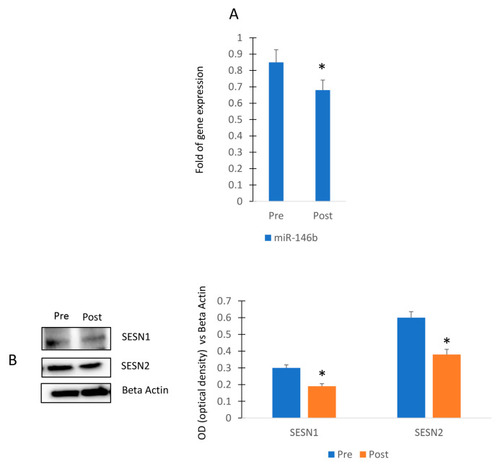
Walking program performed by female participants and miR-146b modulation. RT (real-time)-PCR in circulating miRNAs (Pre) and after (Post) the exercise program (A). Sestrin 1 and Sestrin 2 protein levels in MSCs cultured in presence of sera collected before (Pre) and after (Post) the exercise program (B). The original blots are presented in Supplementary S1. Data are shown as mean ± standard deviation (SD); * p < 0.05.

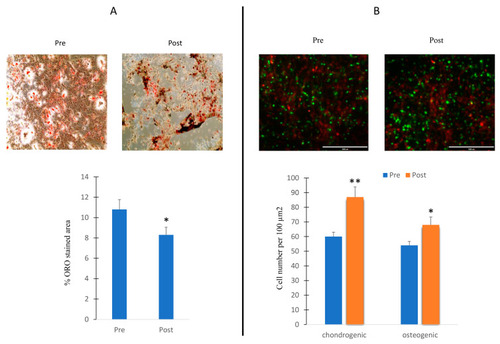
Effects of sera in differentiating cells. MSCs cultured during adipogenesis in presence of sera collected before (Pre) or after (Post) the exercise program. ORO-stained area in cells in presence of Pre and Post sera stimulation (A); 3D cultures of chondroblasts (green) and osteoblasts (red) in presence of Pre and Post sera stimulation (B). The increased chondroblast intensity observed in the post-treatment phase may potentially be attributed to cell overlap. Data are shown as mean  ±  standard deviation (SD); * p < 0.05; ** p < 0.01;. Magnification 10× (A) and 20× (B).

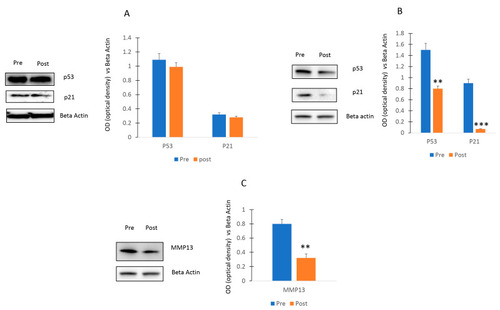
Effects of walking on p53/p21 axis. P53 and p21 levels were not affected in osteogenic cells (A) or decreased in chondrogenic cells (B) cultured Post sera. MMP13 levels (C) were reduced in chondroblastic progenitors stimulated with Post sera. The original blots are presented in Supplementary S1. Data are shown as mean ± standard deviation (SD); ** p < 0.01; *** p < 0.005.

Acknowledgments
This image is the copyrighted work of the attributed author or publisher, and ZFIN has permission only to display this image to its users. Additional permissions should be obtained from the applicable author or publisher of the image. Full text @ Int. J. Mol. Sci.