
- Title
-
The Tumor Suppressor Adenomatous Polyposis Coli (apc) Is Required for Neural Crest-Dependent Craniofacial Development in Zebrafish
- Authors
- Liu, X., Jones, W.D., Quesnel-Vallières, M., Devadiga, S.A., Lorent, K., Valvezan, A.J., Myers, R.L., Li, N., Lengner, C.J., Barash, Y., Pack, M., Klein, P.S.
- Source
- Full text @ J Dev Biol
|
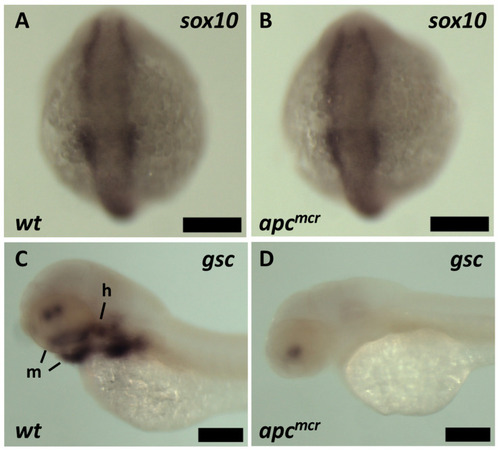
Expression of early and late neural crest markers by in situ hybridization: ( |

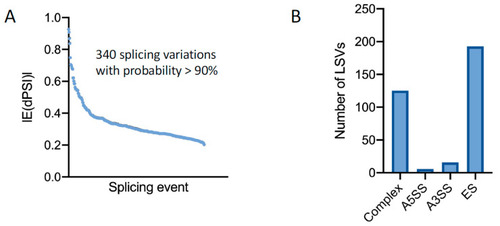
Transcriptomic analysis of |
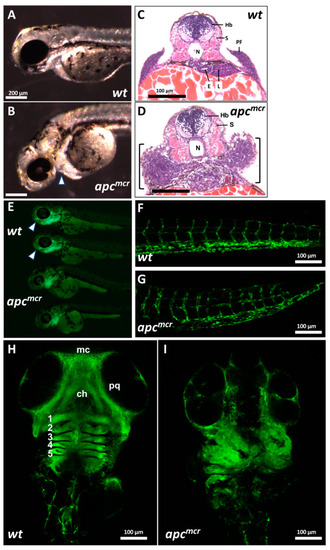
Oncogenic mutations in |

Oncogenic mutations in |