IMAGE

Figure 3

ID
ZDB-IMAGE-230727-12
Source
Figures for Liu et al., 2023
Image
Figure Caption

Figure 3

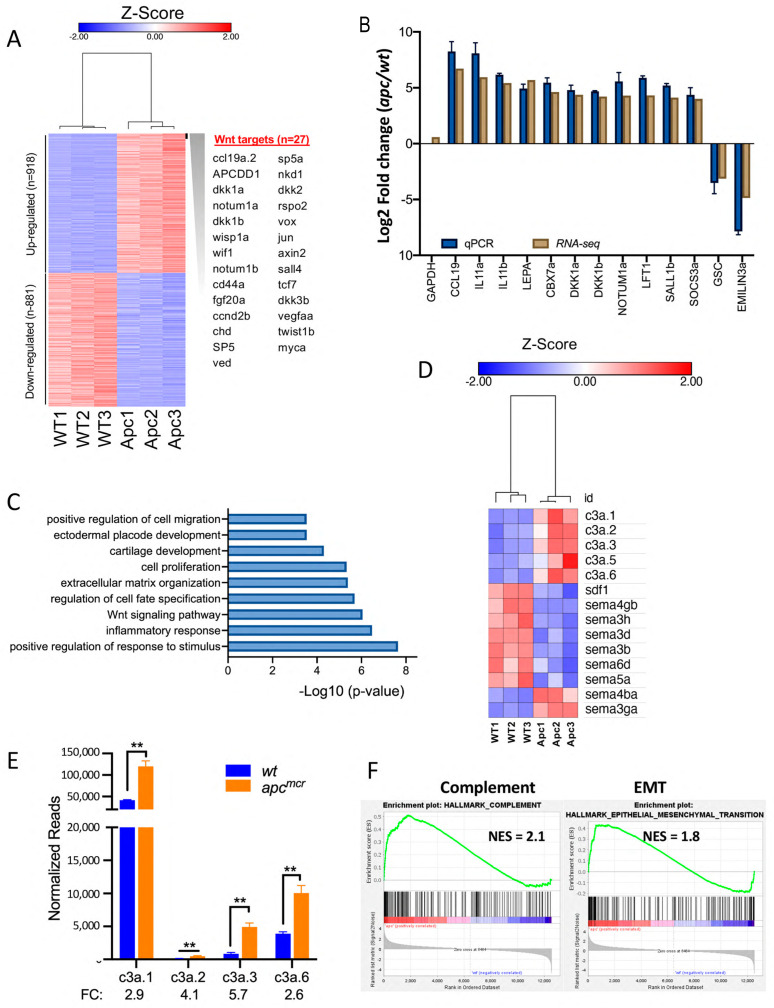
Transcriptomic analysis of apc loss of function larvae: (A) Heat map showing differential gene expression in WT versus apcmcr/mcr larvae at 48 hpf. To the right is a list of a upregulated genes known to be induced by Wnt/β-catenin activation [45], including multiple Wnt-induced pathway antagonists. (B) RT-qPCR was used to validate changes in expression from RNA-seq data for the indicated mRNAs. GAPDH was used as an input control for RT-qPCR. Error bars show standard error. (C) GO analysis (Metascape [37]) shows the differential expression of genes associated with the indicated terms in apcmcr mutants. (D) Heat map showing the differential expression of mRNAs encoding secreted molecules that regulate neural crest migration and axon guidance. In zebrafish, Complement c3 is encoded by “a” and “b” alleles and the c3a alleles were duplicated to six copies, c3a.1–c3a.6. The “c3a.x” designation for these duplicated genes should be distinguished from the more common designation of the polypeptide “C3a”, the extracellular chemoattractant derived via the proteolytic processing of C3 protein that mediates the co-attraction of CNC cells [11]. The heat map also shows the reduced expression of SDF1/CXCL12 and the differential expression of multiple semaphorins. (E) The abundance of c3a.1, c3a.2, c3a.3, and c3a.6 genes in WT and apcmcr larvae at 48 hpf was based on mean normalized read counts from three independent replicates from RNA-seq data. c3a.5 was excluded because mean read counts were <100 and c3a.4 was not detected. Fold change in expression for apcmcr/WT is shown below graph. Relative change in expression was confirmed for c3a.1 and c3a.6 by RT-qPCR (not shown). Error bars show standard error. ** indicates p < 0.01 (Student’s t-test). (F) GSEA analysis [41] for apcmcr/WT zebrafish identifies parallels with the complement pathway and EMT, as well as c-Myc, canonical Wnt signaling, mTORC1 activation, and inflammatory signaling pathways (Supplemental Table S3).

Acknowledgments
This image is the copyrighted work of the attributed author or publisher, and ZFIN has permission only to display this image to its users. Additional permissions should be obtained from the applicable author or publisher of the image. Full text @ J Dev Biol