
- Title
-
COL11A2 as a candidate gene for vertebral malformations and congenital scoliosis
- Authors
- Rebello, D., Wohler, E., Erfani, V., Li, G., Aguilera, A.N., Santiago-Cornier, A., Zhao, S., Hwang, S.W., Steiner, R.D., Zhang, T.J., Gurnett, C.A., Raggio, C., Wu, N., Sobreira, N., Giampietro, P.F., Ciruna, B.
- Source
- Full text @ Hum. Mol. Genet.

Loss of function mutations in col11a2 cause vertebral fusion defects. (A) Schematic of the wildtype Col11a2 protein, showing its domain structure and the position at which gRNAs were targeted to generate the col11a2L642* mutation. This allele encodes a truncated protein, illustrated on the right. (B) Strategy used to create the col11a2del allele. Two gRNAs were targeted to the 5′ and 3′ ends of the col11a2 gene, to delete the intervening 45 kb genomic locus. The resulting col11a2del allele encodes a 13 amino acid peptide. (C) Alizarin red staining of adult wildtype and col11a2L642*/L642* zebrafish, showing vertebral fusion in the posterior spine of col11a2L642*/L642*mutants. Schematic to the right of each image highlights the structure of normal versus fused vertebrae. (D) In vivo staining with alizarin red at 16dpf and calcein at 21dpf labels the developing vertebrae. Fusions in col11a2L642*/L642* and col11a2del/del animals first form along the ventral edge of the spine (arrowheads) and proceed dorsally (asterisks). μCT scans at 8 wpf (weeks post fertilization) demonstrating mature fused vertebrae in each animal (asterisks). |
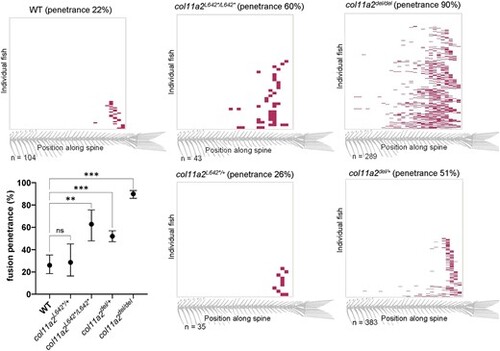
Vertebral fusion in all col11a2 genotypes is biased to the caudal end of the spine. Heatmaps indicating the position of vertebral fusions along the length of the spine, across col11a2 genotypes. Each row of the heatmap represents an individual animal at 21dpf, with colored blocks indicating the positions of fused vertebrae. Graph depicts fusion penetrance between all genotypes, and demonstrates that col11a2del/+ fish have significantly more fusions than wildtype, indicating haploinsufficiency. Significance was calculated by chi-square analysis and error bars represent 95% confidence interval. wt: wild type. ns—not significant, *P < 0.05, **P < 0.01, ***P < 0.001, ****P < 0.0001 |
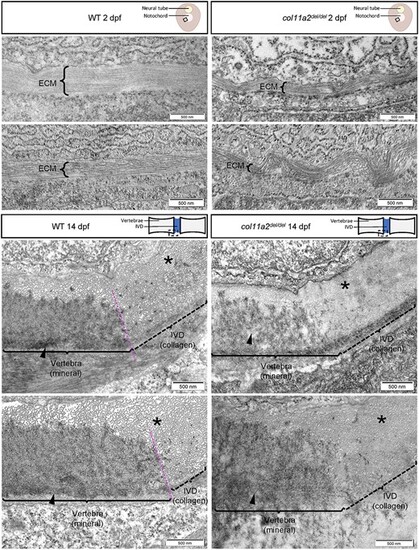
col11a2del/del mutants exhibit disorganized collagen fibrils. Representative TEM images of wildtype (left) and col11a2del/del mutant (right) zebrafish, depicting transverse sections through the notochord of 2dpf embryos (top) and sagittal sections through the spine of 14dpf juvenile fish (bottom). In 2dpf cross sections, brackets labelled ‘ECM’ denote the middle layer of the notochord ECM, which is composed of a thick layer of banded collagen in wildtype embryos. The fibrils of collagen are visible running parallel to the circumference of the notochord. In 2dpf col11a2del/del mutant embryos, the ECM layer is much thinner and exhibits more kinking and bending than wildtype controls. In 14dpf sagittal sections, the edge of the developing vertebrae (brackets, arrowheads) and the intervertebral disc boundary are indicated. In wildtype fish, the vertebra has a clear dense layer of mineral present, with a defined boundary between the vertebral and intervertebral disc region (asterisks), where mineral deposition stops. The intervertebral disc region shows a thick layer of evenly spaced collagen fibrils which are oriented perpendicular to the section. In col11a2del/del mutant animals, the mineral layer of the vertebra appears less dense, and the boundary between mineral and collagen is less defined. The collagen fibrils in these mutants appear denser, with very little space visible between them, and are not oriented perpendicular to the section suggesting a disorganized structure. |
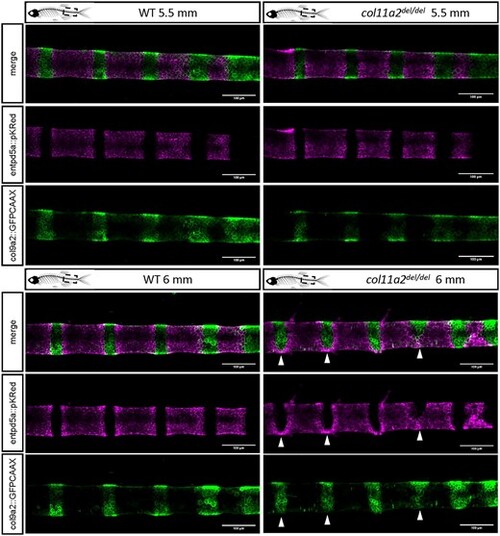
Vertebral fusions occur in the absence of gross notochord patterning and segmentation defects. Alternating domains of entpd5a and col9a2 positive cells are present and appear normal in both WT (left) and col11a2del/del mutant (right) embryos at 5.5 mm SL, prior to the onset of fusions (top). At the onset of fusions (6 mm SL; bottom), ectopic entpd5a positive cells are present in the previously cartilaginous domains of col11a2del/del mutant animals (arrowheads). These cells are also weakly col9a2 positive. |

col11a2del/del juveniles exhibit ectopic osteoblast recruitment to developing vertebrae, prior to fusion events. Larger and more widespread clusters of osteoblasts, labelled by osx::mCherryNTR (arrowheads), are present in col11a2del/del juveniles compared with wildtype controls prior to the onset of vertebral fusion (top). At later stages when fusions are forming (bottom), osteoblasts can be observed localizing dorsal to progressing fusions in col11a2del/del mutant fish (white arrows). |
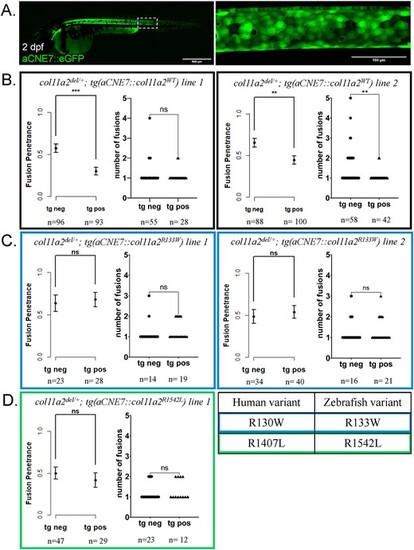
Expression of wildtype col11a2 under the aCNE7 promoter reduces the penetrance of fusion defects in col11a2del/+ fish, while patient mutation-bearing transgenes fail to significantly reduce fusion penetrance. (A) The aCNE7 enhancer element drives gene expression within the embryonic notochord, as demonstrated by an aCNE7::eGFP transgenic reporter. (B-D) Graphs reporting vertebral fusion penetrance (proportion of affected animals) and severity (number of fusions per affected animal) observed in col11a2del/+ fish carrying aCNE7::col11a2WT (B), aCNE7::col11a2R133W (C) and aCNE7::col11a2R1542L (D) transgenic lines. For penetrance graphs, error bars represent 95% confidence interval, and significance calculated using chi-squared analysis. For severity graphs, significance calculated using Student’s t-test. tg neg—transgene negative, tg pos—transgene positive, ns—not significant, *P < 0.05, **P < 0.01, ***P < 0.001, ****P < 0.0001. |
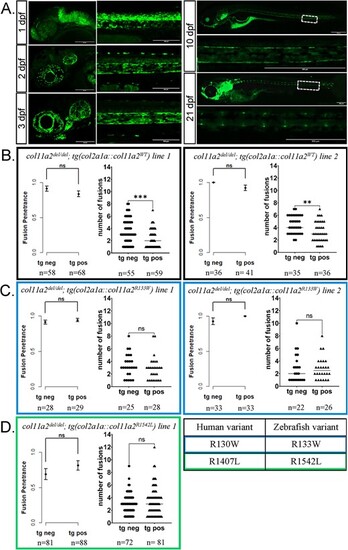
Expression of wildtype col11a2 under the col2a1a promoter reduces the severity, but not penetrance, of fusion defects in col11a2del/del fish, while patient mutation-bearing transgenes fail to significantly reduce fusion severity. (A) The col2a1a promoter drives gene expression expression in the embryonic notochord and later in the juvenile IVDs, as demonstrated by a col2a1a::eGFP transgenic reporter imaged from 1 to 21 dpf. (B-D) Graphs reporting vertebral fusion penetrance and severity observed in col11a2del/del fish carrying col2a1a::col11a2WT (B), col2a1a::col11a2R133W (C), and col2a1a::col11a2R1542L (D) transgenic lines. For penetrance graphs, error bars represent 95% confidence interval, and significance calculated using chi-squared analysis. For severity graphs, significance calculated using Student’s t-test. tg neg—transgene negative, tg pos—transgene positive, ns—not significant, *P < 0.05, **P < 0.01, ***P < 0.001, ****P < 0.0001. |