
- Title
-
Dysregulated TDP-43 proteostasis perturbs excitability of spinal motor neurons during brainstem-mediated fictive locomotion in zebrafish
- Authors
- Asakawa, K., Handa, H., Kawakami, K.
- Source
- Full text @ Dev. Growth Diff.
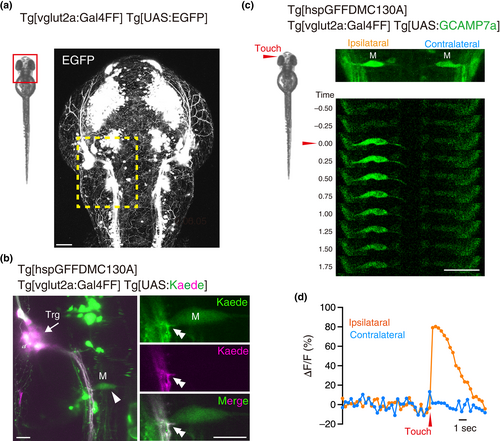
Anatomical and functional connections between trigeminal sensory neurons and Mauthner cells in zebrafish larvae. (a) Dorsal view of the head region of Tg[vglut2a:Gal4FF]; Tg[UAS:EGFP] fish at 48 hpf. The dashed rectangle indicates the area corresponding to the brainstem region analyzed in (b). (b) Left panel: Kaede expressed in the trigeminal sensory neurons is photoconverted by illuminating the trigeminal ganglion region (Trg, arrow) with a laser light with a 405 nm wavelength (magenta). Afferent axons are projected towards a Mauthner cell (arrowhead) highlighted in magenta. Right panels: A single confocal section of the contact site (double arrowheads) of the afferent axons of trigeminal sensory neurons and Mauthner cells. (c) Calcium imaging of the Mauthner cells before and after tactile stimulation. (d) ∆F/F of the neural response of Mauthner cells in (c). Scale bars indicate 50 μm (c) or 20 μm (a, b). |
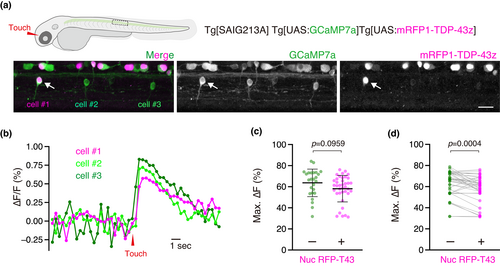
Calcium imaging of the CaPs overexpressing mRFP1-TDP-43z. (a) Lateral view of the spinal cord of Tg[SAIG213A]; Tg[UAS:GCaMP7a]; Tg[UAS:mRFP1-TDP-43z] fish at 48 hpf. Among the three CaPs shown, cell #1 (arrow) displayed the nuclear mRFP1-TDP-43z signal, whereas cell #2 and cell #3 did not. (b) ∆F/F of the three CaPs before and after tactile stimulation of the head. (c, d) Comparison of maximum ∆F/F values between CaPs with or without nuclear mRFP1-TDP-43z signal (Nuc RFP-T43) using non-paired (c) and paired t-tests (d). Results were obtained from 38 trials of 14 CaPs with nuclear mRFP1-TDP-43z and 10 CaPs without nuclear mRFP1-TDP-43z in three animals. The scale bar indicates 20 μm |