
|
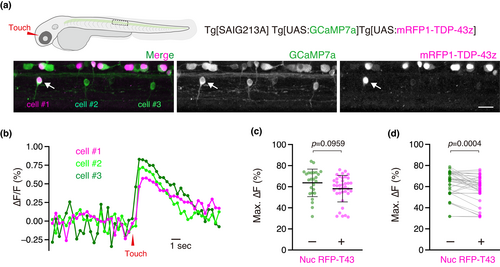
Fig. 2 Calcium imaging of the CaPs overexpressing mRFP1-TDP-43z. (a) Lateral view of the spinal cord of Tg[SAIG213A]; Tg[UAS:GCaMP7a]; Tg[UAS:mRFP1-TDP-43z] fish at 48 hpf. Among the three CaPs shown, cell #1 (arrow) displayed the nuclear mRFP1-TDP-43z signal, whereas cell #2 and cell #3 did not. (b) ∆F/F of the three CaPs before and after tactile stimulation of the head. (c, d) Comparison of maximum ∆F/F values between CaPs with or without nuclear mRFP1-TDP-43z signal (Nuc RFP-T43) using non-paired (c) and paired t-tests (d). Results were obtained from 38 trials of 14 CaPs with nuclear mRFP1-TDP-43z and 10 CaPs without nuclear mRFP1-TDP-43z in three animals. The scale bar indicates 20 μm