
- Title
-
Stimulation of the human mitochondrial transporter ABCB10 by zinc-mesoporphrin
- Authors
- Martinez, M., Fendley, G.A., Saxberg, A.D., Zoghbi, M.E.
- Source
- Full text @ PLoS One
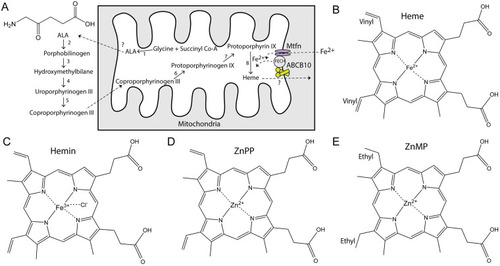
Heme synthesis pathway and structures of porphyrins. (A) Heme synthesis occurs through eight reactions that take place between the mitochondrial matrix and the cytoplasm. The first step is the formation of delta-aminolevulinic acid (ALA, structure shown in the left top corner), which is then exported to the cytoplasm through a yet unidentified mechanism. ABCB10 can form a complex with ferrochelatase (FECH) and mitoferrin (Mtfn). Once synthesized, heme is exported by an unidentified protein. (B) Structure of heme (Fe2+ protoporphyrin). (C) Structure of hemin (Fe3+-Cl protoporphyrin). Commercially available heme comes in the form of hemin since in free heme the iron can be quickly oxidized. (D) Structure of Zn2+-protoporphyrin. (E) Structure of Zn2+-mesoporphyrin; notice the presence of ethyl instead of vinyl groups in the porphyrin ring. All chemical structures were created in ChemDraw. |
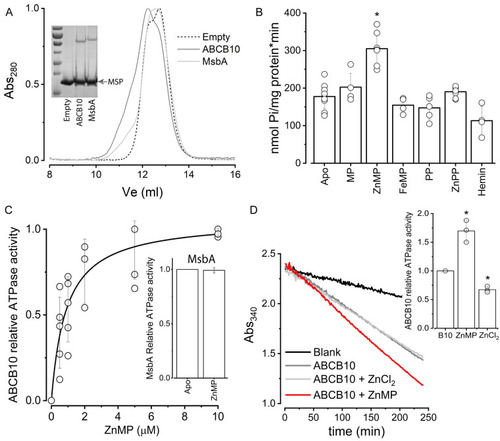
Effect of porphyrins on reconstituted ABCB10. (A) Size exclusion chromatography elution profiles of empty nanodiscs (dashed line) and nanodiscs containing either ABCB10 (dark gray) or MsbA (light gray). The shoulder around 11 ml corresponds to nanodiscs that contain ABC transporter. The inset shows a Coomassie-stained 10% polyacrylamide gel of the nanodisc preparations, with the low molecular band corresponding to MSP1D1 (MSP arrowhead) and the larger molecular weight band to the respective ABC transporter (additional information can be found in |
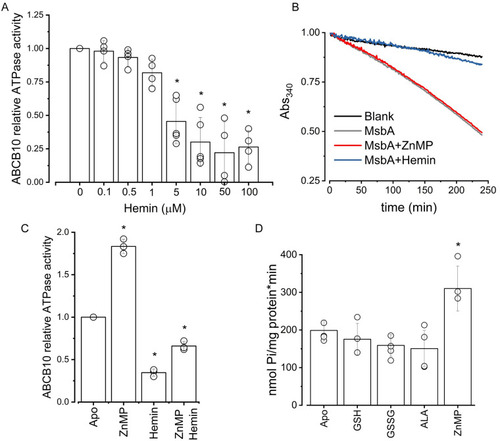
Effect of hemin and other putative substrates on ATPase activity of ABCB10. (A) Relative ATPase activity of ABCB10 at increasing concentrations of hemin. Data normalized to the apo condition. Data from at least three independent experiments, p = 0.05. (B) Representative enzyme-coupled assay of MsbA showing inhibition by 100 μM hemin (blue curve), but no effect by ZnMP (5 μM, red curve). Data normalized to the highest intensity (Absorbance value at time 0). (C) Relative ATPase activity of ABCB10 in the presence of either 5 μM ZnMP or 5 μM Hemin, and in the simultaneous presence of both porphyrins (5 μM each). Data normalized to the apo condition. Data from three independent experiments, with a significant difference between all the conditions (p = 0.05). (D) ABCB10 ATPase activity was measured in the absence (apo) or presence of either 1 mM reduced (GSH) or oxidized (GSSG) glutathione, or 0.5 mM delta-aminolevulinic acid (ALA). ZnMP was used as a positive control at a concentration of 5 μM. Data from at least three independent experiments, p = 0.05. |

Cysteine residues in ABCB10 are not necessary for ZnMP activation (A) Structural model of the ABCB10 homodimer (PDB 3ZDQ, both monomers in cyan), with histidine residues shown as violet sticks and cysteine residues as orange spheres. The expected phospholipid membrane borders are indicated by the dashed lines. TMD and NBD correspond to the transmembrane domain and nucleotide binding domain, respectively. Figure was created in PyMOL. (B) ATPase activity of cysteine less ABCB10 (ABCB10-CL) in the absence (apo) and presence of 5 μM ZnMP (n = 3; p = 0.05). |