
- Title
-
Fusobacterium nucleatum dissemination by neutrophils
- Authors
- Ellett, F., Kacamak, N.I., Alvarez, C.R., Oliveira, E.H.S., Hasturk, H., Paster, B.J., Kantarci, A., Irimia, D.
- Source
- Full text @ J Oral Microbiol
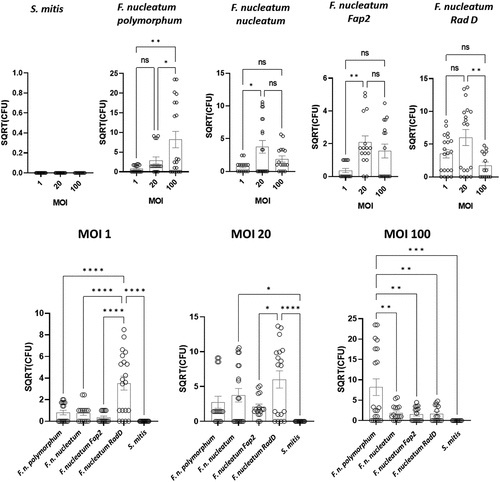
Fn survives inside human neutrophils. Human neutrophils from healthy donors were exposed to Fnn, Fnp, and Fn with deletion of the Fap2 or RadD genes at MOI of 1, 20, or 100. After exposure, the neutrophils were washed to remove all Fn that was not phagocytosed. To confirm the viability of intracellular bacteria, we treated Fn-laden neutrophils with gentamicin for 1 hour, washed them out of the drug, and incubated them for a further 3.5 hours. At 5 hours post-infection, we centrifuged samples and plated out the supernatant and the lysed neutrophil pellet on blood agar media to compare the viability of escaped (extracellular) bacteria in the supernatant to intracellular bacteria in the neutrophil pellet. Intracellular bacteria viability was measured four days after plating and expressed as square root transformation of colony-forming units (CFU). S. mitis, readily killed by neutrophils, was used as a control (N > 14). Plots show individual data points, mean and standard error of the mean (SEM). |

Human neutrophils phagocytose and transport bacteria through microfluidic mazes. a) Diagram detailing the microfluidic device used to measure the migration of neutrophils laden with phagocytosed bacteria. Each device has three independent cell loading channels, and each channel has 24 migration mazes. Each maze (magnified view) fits in one field of view for faster imaging. b) Experimental protocol used. First, bacteria were loaded into the channel, then drawn into the mazes by placing the device under a vacuum. The loading channel was washed with media, leaving the bacteria only in the mazes and the devices submerged in media. Finally, neutrophils were added to the channel. The device was transferred to the microscope stage for time-lapse imaging. The interactions between the moving neutrophils and live bacteria were usually monitored for up to 8 hours. c) Micrographs from a representative time-lapse series showing a neutrophil entering the maze (48 mins), phagocytosing the bacteria, which is acidified (red pHrodo signal 54 mins), and transporting the bacteria around and out of the maze (88 mins). Green and red arrows point at free bacteria and phagocytosed bacteria, respectively. d) Graphs show the velocity of neutrophils migrating in mazes laden with S. mitis, Fnn, and Fnp. Neutrophils laden with Fnn exhibited significantly higher velocity than the other species. Statistics: One-way ANOVA with Tukey?s multiple comparisons test. Each point is the average velocity of one neutrophil track. Data are pooled from N = 3 experiments per condition, N = 50 or more neutrophils per condition. Red horizontal line represents the median and the dashed lines represent the first and third quartile. |

Local dissemination of bacteria in zebrafish. a) Representative images show that host neutrophils (green fluorescence, GFP) disseminate Fnn (red fluorescence, AlexaFluor-594) locally. b) Graph shows the distance of local dissemination over the first five hours post-infection is not dependent on Fn species. Each point on the graph represents the average distribution of all bacteria-laden neutrophils within a single fish. Red horizontal line represents the median and the dashed lines represent the first and third quartile. Statistics: One-way ANOVA with Tukey?s multiple comparisons test. |

Leukocytes are required for disseminating Fnn in vivo. a) Representative images of Control-MO and spi1-MO/csf3r-MO treated larvae 5 hours post-infection (hpi) with F. nucleatum. the Control-MO animal has GFP-expressing neutrophils (green fluorescence), which engulf and distribute AleaFluor-594 labeled bacteria (red fluorescence). Animals injected with a spi1-MO/csf3r-MO cocktail have suppressed leukocyte development. Injected bacteria remain confined at the infection bolus in the developing ear (otic vesicle). b) Graph shows the average distance of fluorescent bacteria from the infection bolus for different bacterial species in Control-MO and spi1-MO/csf3r-MO-injected larvae at 5 hpi. Dispersion of Fnn was significantly reduced at 5 hpi in the absence of leukocytes. Statistics: One-way ANOVA with Tukey?s multiple comparisons test. Each point is the average distance of bacteria from the infection bolus within a fish after 5 hours. Red horizontal line represents the median and the dashed lines represent the first and third quartile. |

Surface proteins modulate neutrophil dissemination of Fn nucleatum ex vivo and in vivo. a) Graph compares the velocity of neutrophils in response to fMLP to cell-laden with wild-type (WT) Fnn or Fnn with deletion of the Fap2 or RadD genes. Cells laden with mutant bacteria maintained higher velocities than those carrying WT bacteria. Each spot represents the average velocity of a neutrophil track. Data are pooled from N = 3 experiments. Red horizontal line represents the median and the dashed lines represent the first and third quartile b) Graph shows that the distribution of zebrafish neutrophils laden with bacteria in vivo at 5 hpi was significantly higher in larvae infected with Fnn Fap2 mutant bacteria. Each spot represents the average distribution of laden neutrophils within an infected zebrafish. Data pooled from N = 3 experiments. Red horizontal line represents the median and the dashed lines represent the first and third quartile (One-way ANOVA with Tukey?s multiple comparisons test.). |