
- Title
-
Multifunctional Mitochondria-Targeting Near-Infrared Fluorescent Probe for Viscosity, ONOO-, Mitophagy, and Bioimaging
- Authors
- Lei, P., Li, M., Dong, C., Shuang, S.
- Source
- Full text @ ACS Biomater Sci Eng
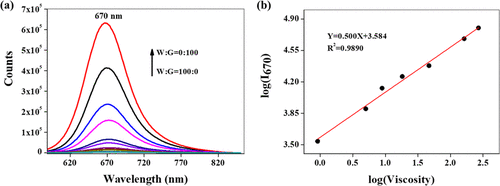
(a) Fluorescence spectra of 10 μM P-1 in different ratios of W (water):G (glycerol). (b) Linearity of log (I670) vs log (viscosity). λex = 590 nm. |
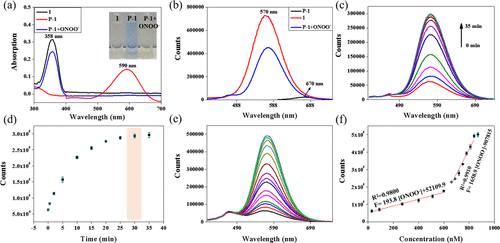
(a) Absorption and (b) fluorescence spectra of 1 (10 μM) and P-1 (10 μM) in the absence and presence of ONOO–. (c) Fluorescence intensity of P-1 reacting with ONOO– for different time periods. (d) Time-dependent fluorescence intensity of P-1 to ONOO–. (e) Fluorescence response of P-1 addition with different concentrations of ONOO– (30–870 nM). (f) Fluorescence intensities of P-1 as a function of ONOO– concentrations. Slit width: dex = dem = 5 nm. |

Colocalization of 1.5 μM MitoTracker Green (a), 3 μM P-1 (b, f), and LysoTracker Green DND-26 (e) in HeLa cells. (c, g) Merged images. (d) Intensity scattering plot of P-1 (Ex = 568 nm, Em = 650–720 nm) with MitoTracker Green (Ex = 488 nm, Em = 490–530 nm). (h) Intensity scattering plot of P-1 with LysoTracker Green DND-26 intensities. |
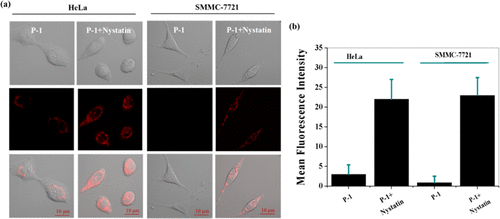
(a) Cell imaging of P-1 (3 μM) induced by nystatin (5 μg/mL) in HeLa and SMMC-7721 cells. (b) Mean fluorescence intensities of P-1 in living cells. λex = 568 nm, λem = 650–720 nm. |
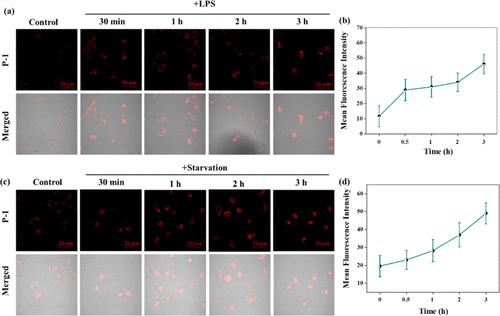
(a) Cell imaging of P-1 (3 μM) induced by LPS for 1, 2, and 3 h, separately. (b) Time dependence of mean fluorescence intensity. (c) Real-time cell imaging of P-1 (3 μM) under starvation conditions. (d) Time dependence of mean fluorescence intensity changes of P-1. P-1: λex = 568 nm, λem = 650–720 nm. Scale bar: 20 μm. |
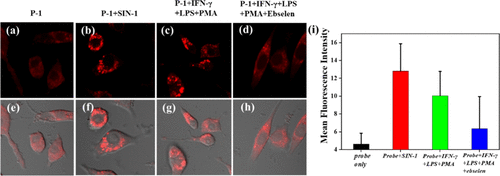
Confocal fluorescence imaging of ONOO– in RAW 264.7 cells. (a) RAW 264.7 cells were incubated with P-1 (3 μM). (b) RAW 264.7 cells were loaded with SIN-1 (100 μM) for 30 min and then with P-1 for 1 h. (c) Cells were incubated with LPS (100 μM) for 4 h, IFN-γ (100 ng/mL) and PMA (10 nM) for 30 min, and then with P-1 for 1 h. (d) Cells were incubated with ebselen (100 μM) for 2 h, LPS for 4 h, IFN-γ and PMA for 30 min, and then with P-1 for 1 h. (e–h) Merged images. (i) Mean fluorescence intensities of panels (e–h). λex = 405 nm, λem = 550–620 nm. |
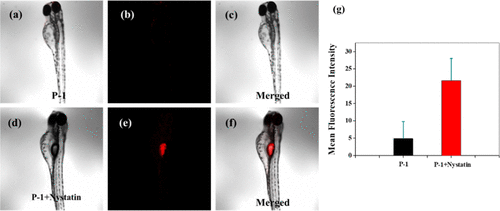
(a–c) Fluorescence images of only P-1 (3 μM) in zebrafish. (d–f) Fluorescence images of P-1 (3 μM) with nystatin (5 μg/mL) in the zebrafish. (g) Time-dependent mean fluorescence intensity changes of P-1. λex = 568 nm, λem = 650–720 nm. |
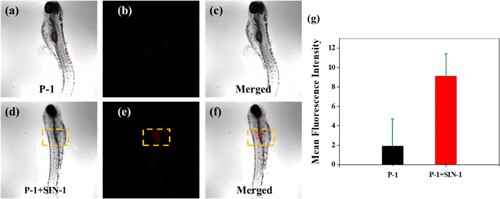
In vivo fluorescence imaging of exogenous ONOO– in zebrafish. (a–c) Fluorescence images of the zebrafish incubated with only P-1 (3 μM). (d–f) Fluorescence images of P-1 (3 μM) with SIN-1 (500 μM) in zebrafish. (g) Time-dependent mean fluorescence intensity changes of P-1. λex = 568 nm, λem = 650–720 nm. |