
Image
|
Figure Caption
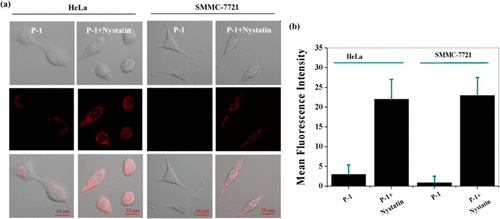
Fig. 4 (a) Cell imaging of P-1 (3 μM) induced by nystatin (5 μg/mL) in HeLa and SMMC-7721 cells. (b) Mean fluorescence intensities of P-1 in living cells. λex = 568 nm, λem = 650–720 nm.
Acknowledgments
This image is the copyrighted work of the attributed author or publisher, and
ZFIN has permission only to display this image to its users.
Additional permissions should be obtained from the applicable author or publisher of the image.
Full text @ ACS Biomater Sci Eng