
- Title
-
Molecular evolution of Keap1 was essential for adaptation of vertebrates to terrestrial life
- Authors
- Yumimoto, K., Sugiyama, S., Motomura, S., Takahashi, D., Nakayama, K.I.
- Source
- Full text @ Sci Adv
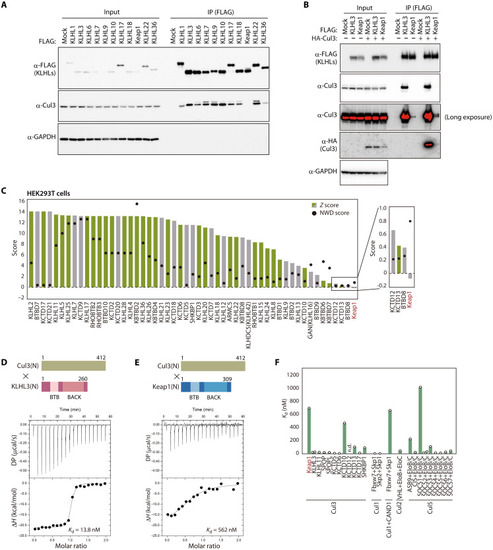
Weaker interaction of Keap1 with Cul3 compared with other receptors.
(A) Lysates of HEK293T cells expressing FLAG-tagged human KLHL proteins were subjected to immunoprecipitation (IP) with antibodies to FLAG, and the resulting precipitates as well as the original lysates (Input) were subjected to immunoblot analysis with the indicated antibodies (?-). GAPDH was examined as a loading control. (B) Lysates of HEK293T cells expressing FLAG-tagged human KLHL3 or Keap1 together with HA-tagged human Cul3 were subjected to immunoprecipitation with antibodies to FLAG, and the resulting precipitates as well as the original lysates were subjected to immunoblot analysis with the indicated antibodies. GAPDH was examined as a loading control. (C) Fifty-three BTB proteins previously found to interact with Cul3 in HEK293T cells (25). Z and NWD scores were obtained from CompPASS analysis (26). Cul3 interactants in the BioPlex 3.0 database (27) are shown in green, with others shown in gray. (D and E) Representative ITC titration curves for interaction between human Cul3(N) and either human KLHL3(N) (D) or human Keap1(N) (E) as well as domain organization of the protein fragments. Baseline-corrected differential power (DP) versus time as well as the normalized binding curve, with integrated changes in enthalpy (?H) plotted against molar ratio, are shown. Each experiment was performed independently at least twice. (F) Dissociation constants for Cullins and the indicated receptors. Values other than those for Keap1 and KLHL3 were obtained from previous studies (21, 23, 28, 54?62). n.d., not detected. |

C3IR of Keap1 is responsible for weak binding to Cul3.
(A) Alignment of amino acid sequences for the BTB domains of human (h) KLHL3, KLHL11, SPOP, and Keap1. Information on secondary structure was obtained from PDB (4HXI for KLHL3, 4AP2 for KLHL11, 4EOZ for SPOP, and 4CXI for Keap1). The numbers of ? helices and ? sheets are in accordance with a previous study (30). (B) Domain organization of human Keap1, human KLHL3, and the exchange mutant proteins Keap1(N3) and Keap1(W?3) as well as a summary of their interaction with Cul3 as determined in (C). (C) HEK293T cells expressing FLAG-tagged wild-type (WT) or mutant forms of human Keap1 together with HA-tagged human Cul3 were incubated in the absence or presence of 25 ?M tBHQ for 24 hours, lysed, and subjected to immunoprecipitation with antibodies to FLAG. The resulting precipitates as well as the original cell lysates were subjected to immunoblot analysis with the indicated antibodies. |
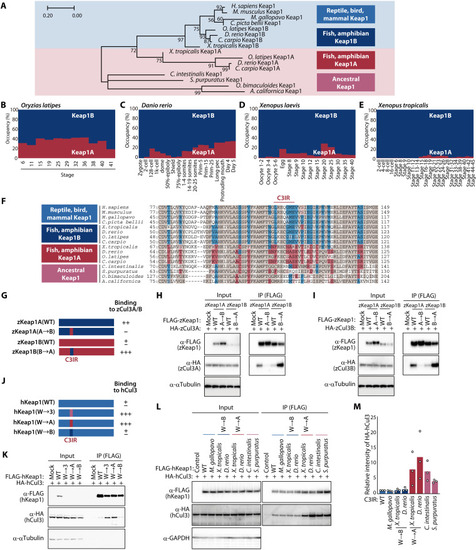
Evolutionary changes in C3IR of Keap1 weakened its interaction with Cul3.
(A) Phylogenetic tree for the BTB domain of Keap1 proteins. The numbers associated with the branches indicate bootstrap values. (B to E) Ratio of Keap1A and Keap1B mRNAs at the indicated developmental stages in O. latipes (B), D. rerio (C), X. laevis (D), and X. tropicalis (E). Data are derived from RNA-seq analysis in previous studies (50?53). (F) Alignment of amino acid sequences for the BTB domain of Keap1 proteins. Keap1A- or Keap1B-specific amino acids are highlighted in red or blue, respectively, with common amino acids shown in brown. (G) Domain organization of zKeap1A, zKeap1B, and the C3IR mutants zKeap1A(A?B) and zKeap1B(B?A) as well as a summary of their interaction with zCul3 as determined in (H) and (I). (H and I) Lysates of HEK293T cells expressing FLAG-tagged zKeap1A, zKeap1B, zKeap1A(A?B), or zKeap1B(B?A) together with HA-tagged zCul3A (H) or zCul3B (I) were subjected to immunoprecipitation with antibodies to FLAG. (J) Domain organization of human Keap1 and the C3IR mutants hKeap1(W?3), hKeap1(W?A), and hKeap1(W?B) as well as a summary of their interaction with human Cul3 as determined in (K). (K) Lysates of HEK293T cells expressing FLAG-tagged hKeap1, hKeap1(W?3), hKeap1(W?A), or hKeap1(W?B) together with HA-tagged hCul3 were subjected to immunoprecipitation with antibodies to FLAG. (L and M) Lysates of HEK293T cells expressing HA-tagged hCul3 together with FLAG-tagged hKeap1 or its exchange mutants containing C3IR of Keap1 proteins from the indicated species were subjected to immunoprecipitation with antibodies to FLAG (L). The relative extent of HA-hCul3 binding to the hKeap1 mutants was also quantitated by densitometry (M). Quantitative data are means from three independent experiments. |
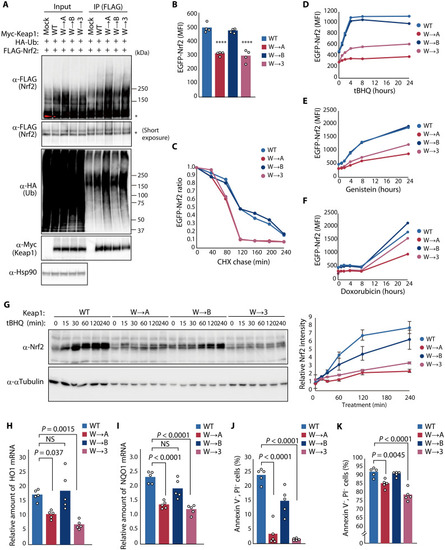
Evolutionary changes in C3IR of Keap1 attenuate ubiquitylation activity and promote Nrf2-dependent responses to oxidative stress.
(A) HEK293T cells expressing Myc-Keap1 or its indicated C3IR mutants together with HA-ubiquitin (Ub) and FLAG-Nrf2 were treated with 10 ?M MG132 for 6 hours, lysed, and subjected to immunoprecipitation with antibodies to FLAG. Asterisks indicate nonubiquitylated forms of FLAG-Nrf2. (B) Median fluorescence intensity (MFI) determined by flow cytometry for EGFP-Nrf2 expressed in HEK293T cells together with FLAG-Keap1 or its C3IR mutants. Data are means; n = 4. ****P < 0.0001 versus WT. (C) MFI of EGFP-Nrf2 expressed together with FLAG-Keap1 or its C3IR mutants that were treated with 1 ?M MLN4924 for 24 hours before washout of MLN4924 and incubation of the cells with cycloheximide (CHX; 50 ?g/ml) for the indicated times. Data are expressed relative to the value for time 0. (D to F) MFI of EGFP-Nrf2 expressed together with FLAG-Keap1 or its C3IR mutants during exposure to 25 ?M tBHQ (D), 100 ?M genistein (E), or 400 nM doxorubicin (F). (G) WT or Keap1 C3IR mutation knock-in HEK293T cells were exposed to 25 ?M tBHQ, lysed, and subjected to immunoblot analysis with antibodies to Nrf2 (left). The relative abundance of endogenous Nrf2 was also quantitated (right). Data are means � SEM; n = 5. (H and I) RT and real-time PCR analysis of HO1 (H) and NQO1 (I) mRNA abundance in WT or Keap1 C3IR mutation knock-in cells at 8 hours after treatment with 25 ?M tBHQ. Data are means; n = 5. NS, not significant. (J and K) Flow cytometric analysis of WT or Keap1 C3IR mutation knock-in cells that were negative for annexin V and propidium iodide (PI) staining after treatment with 0.003% H2O2 (J) or 5 ?M doxorubicin (K) for 24 hours. Data are means; n = 5. |

Keap1W?A/W?A knock-in mice are more sensitive to APAP-induced oxidative stress.
(A) Schematic representation of exon 2 of the WT mouse Keap1 allele, the ssODN, and the W?A (replacement of C3IR of the mouse protein with that of zKeap1A) mutant allele after homologous recombination. The sgRNA and its protospacer adjacent motif are indicated by continuous and dotted overlines, respectively. The 5? untranslated region and open reading frame of Keap1 are represented by the light and dark gray boxes, respectively. The mutation is shown in red. (B) GSEA plot performed for a gene set consisting of Nrf2 target genes with RNA-seq data obtained from the liver of 8-week-old Keap1W?A/W?A and WT mice. NES, normalized enrichment score. (C) GO analysis of core enrichment genes in (B). The size of the bubbles indicates the number of genes enriched in the corresponding GO term, and their color represents the E ratio (48). (D) Experimental plan for assessment of liver injury induced by an overdose of APAP. (E and F) Representative hematoxylin and eosin staining of liver sections from APAP-treated Keap1W?A/W?A or WT mice (E). The area of necrosis in such sections was quantified with ImageJ/Fiji (F). Quantitative data are means from eight or nine mice of each genotype. (G) Representative TUNEL staining for the liver of APAP-treated Keap1W?A/W?A or WT mice. (H to J) Serum cholesterol ester/total cholesterol ratio (H) as well as AST (I) and ALT (J) activities for APAP-treated WT, Keap1WT/W?A, or Keap1W?A/W?A mice. Data are means for 8 or 10 mice of each genotype. (K) GSH/GSSG ratio for the liver of APAP-treated WT, Keap1WT/W?A, or Keap1W?A/W?A mice. Data are means for 8 or 10 mice of each genotype. (L) Immunohistochemical staining of 4-HNE in liver sections from APAP-treated Keap1W?A/W?A or WT mice. Scale bars, 100 ?m. |

Keap1W?A/W?A knock-in mice are sensitive to oxidative stress induced by sunlight-level UV radiation.
(A) The mouse fetus is protected from oxidative stress in the womb but is exposed to high ROS levels after birth as a result of the high ambient oxygen concentration and UV in sunlight. (B) Kaplan-Meier survival curves for WT, Keap1WT/W?A, and Keap1W?A/W?A mice exposed to UV-A/B radiation. (C) Concentration of MDA in urine of indicated mice that had been subjected (or not) to UV-A/B irradiation. Data are means for 8 to 14 mice of each genotype. (D) Concentration of MDA in skin of indicated mice that had been subjected to UV-A/B irradiation. Data are means for 10 to 12 mice of each genotype. (E and F) GSEA plots for gene sets associated with the response to oxidized phospholipids (E) or the inflammatory response (F) that were constructed from RNA-seq data for skin of Keap1W?A/W?A and WT mice that had been exposed to UV-A/B radiation. (G) Concentration of MDA in lung of indicated mice that had been subjected to UV-A/B irradiation. Data are means for 10 to 12 mice of each genotype. (H) Volcano plot for RNA-seq data from lung of Keap1W?A/W?A and WT mice that had been exposed to UV-A/B radiation. (I) GO analysis of differentially expressed genes up-regulated in Keap1W?A/W?A mouse lung in (H). (J) Heatmap of differentially expressed genes in the gene set related to the inflammatory response (F) that was constructed from the RNA-seq data for lung tissue in (H) as well as for that of mice not subjected to UV irradiation. (K) Proportion of monocyte-derived M1 macrophages in lung of indicated mice that had been subjected to UV-A/B irradiation. Data are means for 5 to 27 mice of each genotype. |