
|
Fig. 6
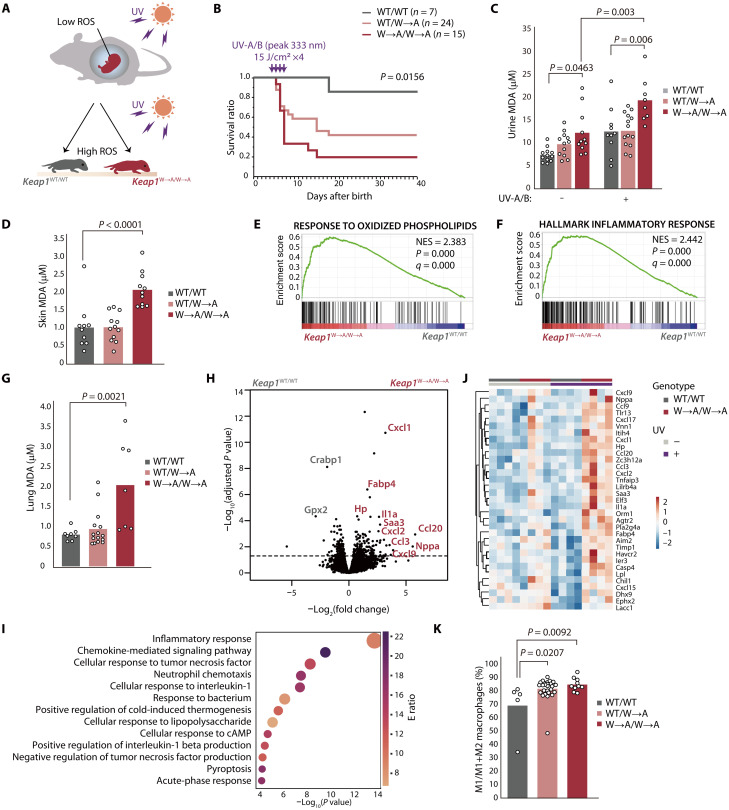
(A) The mouse fetus is protected from oxidative stress in the womb but is exposed to high ROS levels after birth as a result of the high ambient oxygen concentration and UV in sunlight. (B) Kaplan-Meier survival curves for WT, Keap1WT/W→A, and Keap1W→A/W→A mice exposed to UV-A/B radiation. (C) Concentration of MDA in urine of indicated mice that had been subjected (or not) to UV-A/B irradiation. Data are means for 8 to 14 mice of each genotype. (D) Concentration of MDA in skin of indicated mice that had been subjected to UV-A/B irradiation. Data are means for 10 to 12 mice of each genotype. (E and F) GSEA plots for gene sets associated with the response to oxidized phospholipids (E) or the inflammatory response (F) that were constructed from RNA-seq data for skin of Keap1W→A/W→A and WT mice that had been exposed to UV-A/B radiation. (G) Concentration of MDA in lung of indicated mice that had been subjected to UV-A/B irradiation. Data are means for 10 to 12 mice of each genotype. (H) Volcano plot for RNA-seq data from lung of Keap1W→A/W→A and WT mice that had been exposed to UV-A/B radiation. (I) GO analysis of differentially expressed genes up-regulated in Keap1W→A/W→A mouse lung in (H). (J) Heatmap of differentially expressed genes in the gene set related to the inflammatory response (F) that was constructed from the RNA-seq data for lung tissue in (H) as well as for that of mice not subjected to UV irradiation. (K) Proportion of monocyte-derived M1 macrophages in lung of indicated mice that had been subjected to UV-A/B irradiation. Data are means for 5 to 27 mice of each genotype.