
- Title
-
Genome-wide identification and spatiotemporal expression profiling of zinc finger SWIM domain-containing protein family genes
- Authors
- Hassan, I.U., Rehman, H.M., Liu, Z., Zhou, L., Samma, M.K., Wang, C., Rong, Z., Qi, X., Cai, D., Zhao, H.
- Source
- Full text @ Zool Res
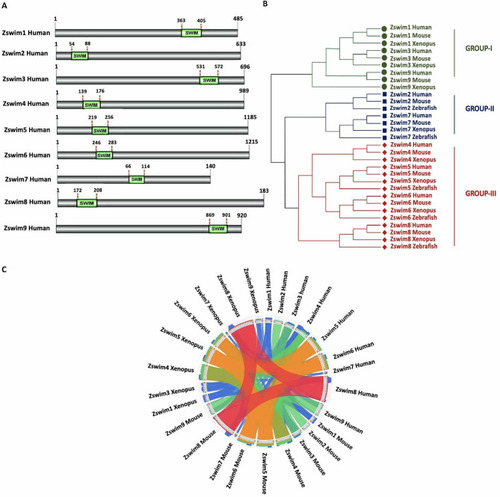
Identification of ZSWIM family members A: Identification of human ZSWIM family members and precise position of SWIM domain in each member. Identified SWIM domain is shown in green, and its position is labeled at the top of each domain. B: Phylogenetic relationships among human, mouse, Xenopus, and zebrafish ZSWIM proteins. Phylogenetic tree was constructed using the NJ method in MEGA v11. The three groups are indicated by different colors and designated as groups I?III. C: Syntenic analysis of ZSWIM family members in humans, mice, Xenopus, and zebrafish. In the circle, ribbons represent four quartiles of the maximum score, represented by semitransparent blue, green, orange, and red. |

Expression profiles of ZSWIM genes in human organs and GO analysis A: Heatmap showing expression profiles of ZSWIM genes in twenty-seven major human organs/tissues. Different colors represent RPKM values, as indicated in the bar at the top of the figure. B: Graphical representation of zswim gene expression profiles in five major organs/tissues in Xenopus. C: Heatmap shows GO terms associated with various biological processes involving ZSWIM family members. |
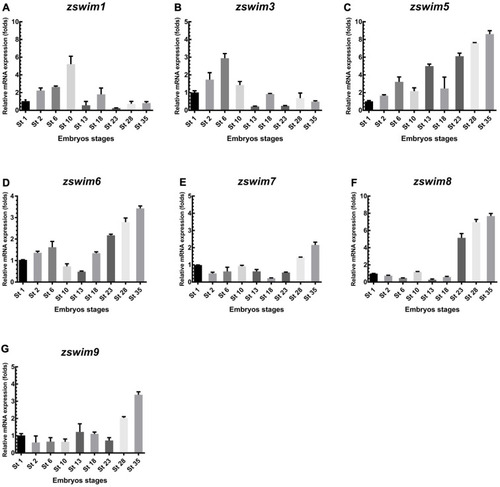
qRT-PCR analysis of zswim gene expression in Xenopus embryos A?G: mRNA expression level of Xenopus zswim genes was measured at different embryonic stages, including in fertilized egg (stage 1), cleavage (stage 2), blastula (stage 6), gastrula (stage 10), neurula (stages 13, 18), early tailbud (stages 23, 28), and late tailbud stages (stage 35). ODC served as the internal standard control. |

Spatial gene expression patterns of zswim1 and zswim3 Spatial expression levels of zswim1 and zswim3 were analyzed by whole-mount in situ hybridization. Embryonic stages are shown at the bottom. Detailed explanations of expression patterns are described in the Results section. A, E: Stage 3, animal view. B, F: Stage 3, lateral view. C, G: Early blastula stage embryo (stage 6), animal view. D, H: Gastrula stage embryo (stage 11), blastopore lip indicated by the red arrow. a, animal; bl, blastopore lip; v, vegetal. |

Dynamic expression of zswim5 throughout embryogenesis A?A?: Stage 2 embryo, animal view (A), lateral view (A?), vegetal view (A?). B?B?: Stage 3 embryo, animal view (B), lateral view (B?), vegetal view (B?). C, C?: Early blastula stage (stage 6), animal view (C), lateral view (C?). D: Gastrula stage (stage 10), blastopore lip is indicated by red arrow. E, E?: Early neurula stage (stage 14), dorsal view (E), lateral view (E?). E?: Transverse section of stage 14 embryo. F: Late neural stage (stage 18), dorsal view. G?G?: Neural stage (stage 22), lateral, dorsal, and anterior views. H, H?: Early tailbud stage (stage 24), lateral view (H), anterior view (H?). I?I?: Longitudinal sections from stage 24 embryo. J, J?: Transverse sections from stage 24 embryos. K?O: Tailbud stages (stages 28 to 34), lateral view. P?P??: Longitudinal section from late tailbud stage (stage 34). Q, Q?: Transverse section from late tailbud stage (stage 34). a, animal; b, brain; bl, blastopore lip; cg, cement gland; e, eye; fb, forebrain; md, midbrain; hb, hindbrain; msz, marginal and subventricular zone; np, neural plate; op, olfactory placode; pg, pineal gland; rgcl, retinal ganglion cell layer; s, somites; tn, trigeminal nerve; tp, trigeminal placode; vn, vestibulocochlear nerve. |
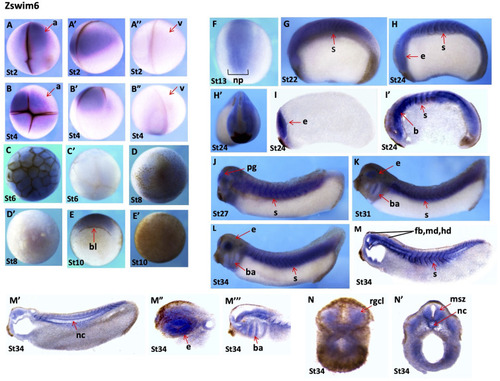
Spatial gene expression patterns of zswim6s A?A?: Stage 2 embryo, animal view (A), lateral view (A?), vegetal view (A?). B?B?: Stage 3 embryo, animal view (B), lateral view (B?), and vegetal view (B?). C, C?: Early blastula stage (stage 6), animal view (C), vegetal view (C?). D, D?: Embryo at late blastula stage, animal view (D), vegetal view (D?). E: Embryo at gastrula stage (stage 10), blastopore lip is indicated by red arrow. F: Animal view. Embryo at neurula stage (stage 13), dorsal view. G: Early tailbud stage (stage 22). H, H?: Stage 24, lateral view (H), anterior view (H?). I, I?: Longitudinal sections of embryo at stage 24. J?L: Late tailbud stages (stages 27 to 34), lateral view. M?M??: Tailbud stage (stage 34), longitudinal section. N, N?: Late tailbud stage (stage 34), transverse section. a, animal; b, brain; bl, blastopore lip; br, branchial arch; e, eye; msz, marginal and subventricular zone; nc, notochord; np, neural plate; pg, pineal gland; rgcl, retinal ganglion cell layer; s, somites; v, vegetal. |

Spatial gene expression patterns of zswim7 and zswim8 Spatial expression levels of zswim7 and zswim8 were analyzed by whole-mount in situ hybridization. Embryonic stages are indicated at the bottom of each image. A?C: Spatial expression of zswim7. Tailbud stages (stages 24 to 30), lateral view. D, E: Spatial expression of zswim8. D?G: Embryos at early tailbud stage (stage 24), lateral view (D), anterior view (E), longitudinal section (F), and transverse section (G). H, I: Embryos at tailbud stages (H, stage 30 and I, stage 34), lateral view. J?J??: Longitudinal section of embryos at late tailbud (stage 34). b, brain; ba, branchial arch; e, eye; fb, fore brain; hb, hind brain; mb, mid brain; nc, notochord; pg, pineal gland; s, somites; tn, trigeminal nerves. |