
Image
|
Figure Caption
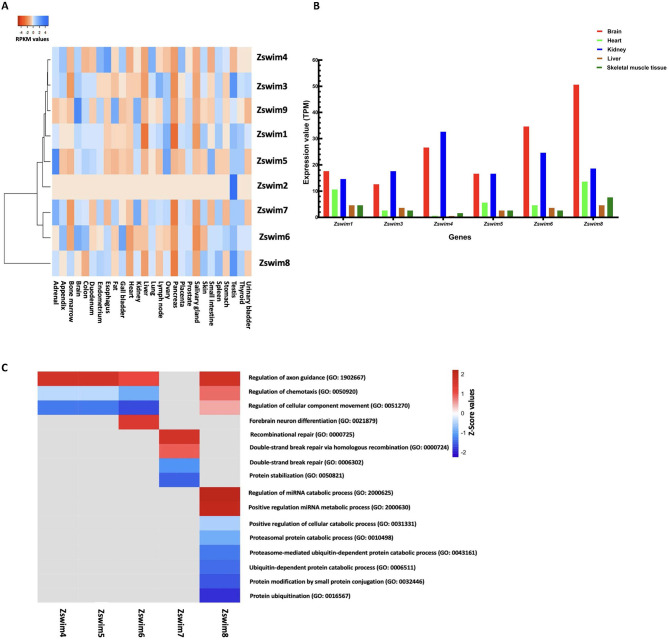
Fig. 2
Expression profiles of ZSWIM genes in human organs and GO analysis
A: Heatmap showing expression profiles of ZSWIM genes in twenty-seven major human organs/tissues. Different colors represent RPKM values, as indicated in the bar at the top of the figure. B: Graphical representation of zswim gene expression profiles in five major organs/tissues in Xenopus. C: Heatmap shows GO terms associated with various biological processes involving ZSWIM family members.
Acknowledgments
This image is the copyrighted work of the attributed author or publisher, and
ZFIN has permission only to display this image to its users.
Additional permissions should be obtained from the applicable author or publisher of the image.
Full text @ Zool Res