
- Title
-
Glia maturation factor-γ is required for initiation and maintenance of hematopoietic stem and progenitor cells
- Authors
- Li, H., Luo, Q., Cai, S., Tie, R., Meng, Y., Shan, W., Xu, Y., Zeng, X., Qian, P., Huang, H.
- Source
- Full text @ Stem Cell Res. Ther.
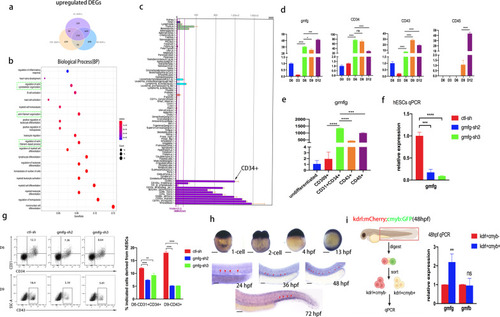
gmfg is a potential regulator of HSPC development. a Venn diagram showing the upregulated DEGs in the PSC-, FL- and BM-derived HSPCs as compared to undifferentiated PSCs (172 common upregulated DEGs). b Top 20 statistically enriched pathways of the common upregulated DEGs in the PSC-, FL- and BM-derived HSPCs. c gmfg expression in human tissues. The abscissa represents different human tissues, the ordinate represents gene expression level, and the histogram represents the expression level of gmfg in specific human tissue. Black arrow denotes gmfg expression in CD34 + cells. d Dynamic analysis of gmfg, CD34, CD43 and CD45 expression with real-time PCR during hESC hematopoietic differentiation. Relative expression is normalized by undifferentiated hESCs (except for CD45 by differentiated hESCs at D9). Data are shown as mean ± SD (n = 3). ns, not significant; *p < 0.05, ***p < 0.001, ****p < 0.0001. e Quantitative RT-PCR analysis of gmfg expression in undifferentiated hESCs, mesoderm (CD309 +), HEPs (CD31 + CD34 +), and HPCs (CD43 + and CD45 +) derived from hESCs. Relative expression was normalized by undifferentiated hESCs. Data are shown as mean ± SD (n = 3). ***p < 0.001, ****p < 0.0001. f Quantitative RT-PCR analysis of gmfg expression in hESCs treated with ctl-sh, gmfg-sh2, and gmfg-sh3. Data are shown as mean ± SD (n = 3). ***p < 0.001, ****p < 0.0001. g Flow cytometry analysis of CD31 + CD34 + HEPs and CD43 + HPCs generated from ctl-sh, gmfg-sh2, and gmfg-sh3 hESCs at day6 and day9 of differentiation, respectively. Data are shown as mean ± SD (n = 3). **p < 0.01, ****p < 0.0001. h Expression pattern of gmfg during zebrafish embryogenesis: The stage examined by whole-mount in situ hybridization (WISH) is shown in each panel: 1‐cell stage, 2‐cell stage, 4 h postfertilization (hpf), 13 hpf (Scale bars: 200 μm), 24 hpf, 36 hpf, 48 hpf and 72 hpf (Scale bars: 100 μm). i (left) Graphic representation of the sorting strategy of kdrl + cmyb- ECs and kdrl + cmyb + HE from kdrl:mCherry;cmyb:GFP transgenic zebrafish by FACS at 48 hpf. (right) Quantitative RT-PCR analysis of gmfg and gmfb expression in FACS-sorted kdrl + cmyb- ECs and kdrl + cmyb + HE. Bars represent mean ± SD (n = 3). ns, not significant; **p < 0.01 |
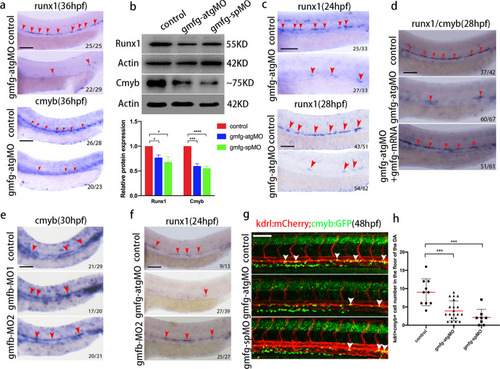
Loss of gmfg, but not gmfb, induces HSPC defects. a WISH results of runx1 and cmyb in the AGM in control and gmfg morphants at 36 hpf. The red arrowheads indicate the expression of runx1 and cmyb. b Western blotting showing the protein level of Runx1 and Cmyb in control and gmfg morphants at 36 hpf. Representative blot is shown in the figure (Full-length blots are presented in Additional file 2: Fig. S1 and S2). Data represent mean ± SEM intensity of indicated blots (n ≥ 3). *p < 0.05, ***p < 0.001, ****p < 0.0001. c WISH analysis showing the expression of runx1 (red arrowheads) in the DA in control and gmfg morphants at 24 and 28 hpf. d WISH analysis showing runx1/cmyb expression (red arrowheads) in the DA in control, gmfg-atgMO, and coinjection of gmfg-atgMO and gmfg mRNA embryos at 28 hpf. e WISH analysis showing the expression of cmyb (red arrowheads) in the DA in embryos injected with control MO and gmfb-MO at two different doses (gmfb-MO1: 9.6 ng and gmfb-MO2: 12.8 ng per embryo) at 30 hpf. f Representative images showing runx1 expression (red arrowheads) in the DA in control, gmfg-atgMO and gmfb-MO2 (12.8 ng per embryo) at 24 hpf. g Maximum projections of 48 hpf kdrl:mCherry; cmyb:GFP double-transgenic embryos injected with control MO, gmfg-atgMO, and gmfg-spMO. Arrowheads denote kdrl + cmyb + HE along the DA. All views: anterior to left. h Enumeration of kdrl + cmyb + HE shown in (g). Bars represent mean ± SD of control MO (n = 10), gmfg-atgMO (n = 21), and gmfg-spMO (n = 8). ***p < 0.001. Numbers at the lower right corner of the picture represent embryos with displayed phenotype/whole embryos. All scale bars, 100 µm |
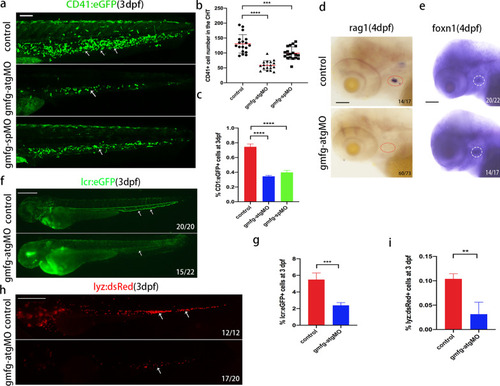
Loss of gmfg impairs the differentiation potential of HSPCs. a Maximum projections of 3 dpf cd41:eGFP transgenic embryos injected with control MO, gmfg-atgMO, and gmfg-spMO. White arrowheads denote cd41 + cells in the CHT. All views: anterior to left. Scale bar, 100 μm. b Enumeration of cd41 + cells shown in (a). Bars represent mean ± SD of control (n = 18), gmfg-atgMO (n = 17), and gmfg-spMO (n = 18). ***p < 0.001, ****p < 0.0001. c FACS analysis showing the percentage of cd41 + cells in the dissected trunk and tail of control, gmfg-atgMO, and gmfg-spMO at 3 dpf (n = 3). ****p < 0.0001. d and e WISH for the T lymphocyte marker rag1 (left, red dotted line circle) and thymic epithelial marker foxn1 (right, white dotted line circle), respectively, in embryos injected with control MO and gmfg-atgMO at 4 dpf. All views are lateral, with anteriors to left. Scale bars, 50 µm. f and h lcr:eGFP and lyz:dsRed transgenic embryos injected with control MO and gmfg-atgMO were visualized at 3 dpf. Scale bars, 500 μm. g and i FACS analysis showing the percentage of lcr + erythrocytes and lyz + neutrophils in whole embryos of control and gmfg-atgMO groups at 3 dpf (n = 3). **p < 0.01, ***p < 0.001. Numbers at the lower right corner of the picture represent embryos with displayed phenotype/whole embryos |
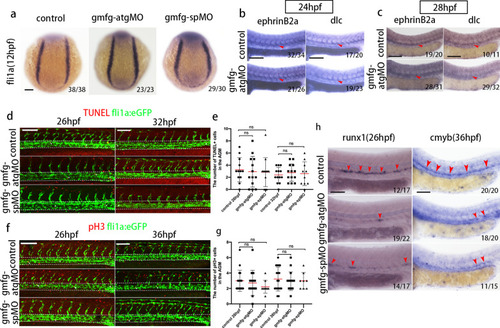
The effect of gmfg deficiency on PLM formation, DA specification, and EC proliferation or apoptosis. a Expression of the PLM marker fli1a in embryos injected with control MO, gmfg-atgMO, and gmfg-spMO analyzed by WISH at 12 hpf. b and c Expression of the DA-specific markers ephrinB2a and dlc in control and gmfg morphants analyzed by WISH at 24 (b) and 28 hpf (c). d TUNEL staining in fli1a:eGFP transgenic embryos injected with control MO, gmfg-atgMO, and gmfg-spMO at 26 and 32 hpf. White dashed lines indicate blood vessels and white arrowheads indicate the apoptosis of fli1a + cells. e Quantification of apoptotic fli1a + TUNEL + cells in (d). Bars represent mean ± SD of control (n = 18), gmfg-atgMO (n = 17), and gmfg-spMO (n = 18). ns, not significant. f PH3 staining in fli1a:eGFP transgenic embryos injected with control MO, gmfg-atgMO, and gmfg-spMO at 26 and 36 hpf. White dashed lines indicate blood vessels and white arrowheads indicate proliferative fli1a + cells. g Quantification of proliferative fli1a + pH3 + cells in (f), Bars represent mean ± SD of control (n = 18), gmfg-atgMO (n = 17), and gmfg-spMO (n = 18). ns, not significant. h Expression of runx1 and cmyb in the AGM in p53 mutant injected with control MO, gmfg-atgMO, and gmfg-spMO at 26 (left) and 36 hpf (right). The red arrowheads mark HSPCs in the AGM. Numbers at the lower right corner of the picture represent embryos with displayed phenotype/whole embryos. All scale bars, 100 µm |
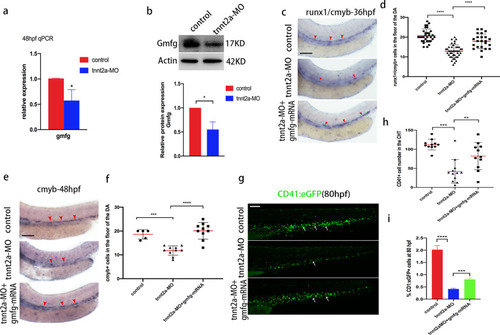
gmfg mediates blood flow-dependent HSPC development. a Quantitative RT-PCR analysis of gmfg expression in FACS-sorted kdrl + cmyb + HE of control and tnnt2a-MO embryos at 48 hpf. Bars represent mean ± SD (n = 3). *p < 0.05. b Western blotting showing the protein level of Gmfg in the dissected trunk and tail of control and tnnt2a-MO embryos at 48 hpf. Representative blot is shown in the figure (Full-length blots are presented in Additional file 2: Fig. S3). Data represent mean ± SEM intensity of indicated blots (n = 3). *p < 0.05. c Representative images showing runx1/cmyb expression (red arrowheads) in the DA in control, tnnt2a-MO, and coinjection of tnnt2a-MO and gmfg mRNA embryos at 36 hpf. d Enumeration of runx1 + /cmyb + HSPCs shown in (c). Bars represent mean ± SD of control (n = 32), tnnt2a-MO (n = 43), and tnnt2a-MO + gmfg-mRNA (n = 23) embryos. ****p < 0.0001. e Representative images showing cmyb expression (red arrowheads) in the DA of control, tnnt2a-MO, and coinjection of tnnt2a-MO and gmfg mRNA embryos at 48 hpf. f Enumeration of cmyb + HSPCs shown in (e). Bars represent mean ± SD of control (n = 5), tnnt2a-MO (n = 10), and tnnt2a-MO + gmfg-mRNA (n = 10) embryos. ***p < 0.001, ****p < 0.0001. g Maximum projections of 80 hpf cd41:eGFP transgenic embryos injected with control MO, tnnt2a-MO, and tnnt2a-MO + gmfg-mRNA. Arrowheads denote cd41 + cells in the CHT. All views: anterior to left. h Enumeration of cd41 + cells shown in (g). Bars represent mean ± SD of control (n = 11), tnnt2a-MO (n = 12), and tnnt2a-MO + gmfg-mRNA (n = 11) embryos. **p < 0.01, ***p < 0.001. i FACS analysis showing the percentage of cd41 + cells in the dissected trunk and tail of control, tnnt2a-MO, and tnnt2a-MO + gmfg-mRNA embryos at 80 hpf (n = 3). ***p < 0.001, ****p < 0.0001. All scale bars, 100 µm |
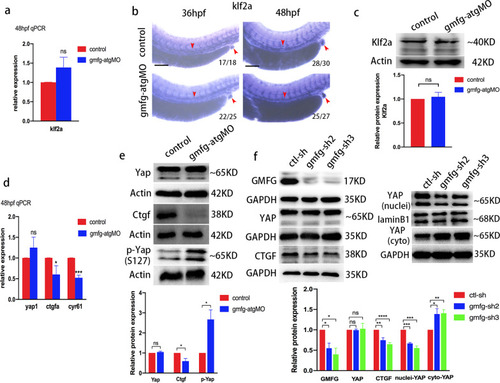
gmfg regulates Yap activity. a Quantitative RT-PCR analysis of klf2a expression in FACS-sorted HE of control and gmfg-atgMO embryos at 48 hpf. Bars represent mean ± SD (n = 3). ns, not significant. b WISH analysis of klf2a expression in the trunk and the cloaca (red arrowheads) of control and gmfg-atgMO embryos at 36 and 48 hpf, respectively. Numbers at the lower right corner of the picture represent embryos with displayed phenotype/whole embryos. Scale bars, 100 µm. c Western blotting showing the protein level of Klf2a in the dissected trunk and tail of control and gmfg-atgMO embryos at 54 hpf. Representative blot is shown in the figure (Full-length blots are presented in Additional file 2: Fig. S4). Data represent mean ± SEM intensity of indicated blots (n = 4). ns, not significant. d Quantitative RT-PCR analysis of yap1, ctgfa and cyr61 expression in FACS-sorted HE of control and gmfg-atgMO embryos at 48 hpf. Bars represent mean ± SD (n = 3). ns, not significant; **p < 0.05, ***p < 0.001. e Western blotting showing the protein level of Yap, Ctgf and p-Yap (S127) in the dissected trunk and tail of control and gmfg-atgMO embryos at 48 hpf. Representative blot is shown in the figure (Full-length blots are presented in Additional file 2: Figs. S5–S7). Data represent mean ± SEM intensity of indicated blots (n = 3). ns, not significant; *p < 0.05. f Western blotting showing the protein level of GMFG, total YAP, CTGF, nuclear and cytoplasmic YAP in HUVEC treated with ctl-sh, gmfg-sh2 and gmfg-sh3. Representative blot is shown in the figure (Full-length blots are presented in Additional file 2: Figs. S8–S12). Data represent mean ± SEM intensity of indicated blots (n ≥ 3). ns, not significant; *p < 0.05; **p < 0.01; ***p < 0.001, ****p < 0.0001 |
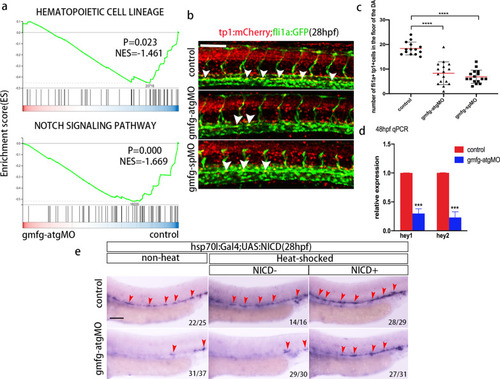
gmfg acts upstream of Notch during HSPC initiation. a GSEA profiles depicting the enriched processes in “hematopoietic cell lineage” and “Notch signaling pathway”. b tp1:mCherry;fli1a:eGFP double transgenic embryos injected with control MO, gmfg-atgMO, and gmfg-spMO were visualized at 28 hpf. White arrowheads indicate cells in the DA with active Notch signaling. c Enumeration of tp1 + fli1a + Notch-active ECs from (b). Bars represent mean ± SD of control (n = 14), gmfg-atgMO (n = 16), and gmfg-spMO (n = 16) embryos. ****p < 0.0001. d Quantitative RT-PCR results of Notch target genes hey1 and hey2 in FACS-sorted HE of control and gmfg-atgMO embryos at 48 hpf. Bars represent mean ± SD (n = 3). ***p < 0.001. e hsp70l:Gal4;UAS:NICD embryos injected with control MO and gmfg-atgMO were heat shocked at 12–14 hpf and WISH for runx1 was performed at 28 hpf. Arrowheads denote runx1 + HSPCs along the DA. Numbers at the lower right corner of the picture represent embryos with displayed phenotype/whole embryos. All scale bars, 100 µm |