
Fig. 3
- ID
- ZDB-FIG-230504-6
- Publication
- Li et al., 2023 - Glia maturation factor-γ is required for initiation and maintenance of hematopoietic stem and progenitor cells
- Other Figures
- All Figure Page
- Back to All Figure Page
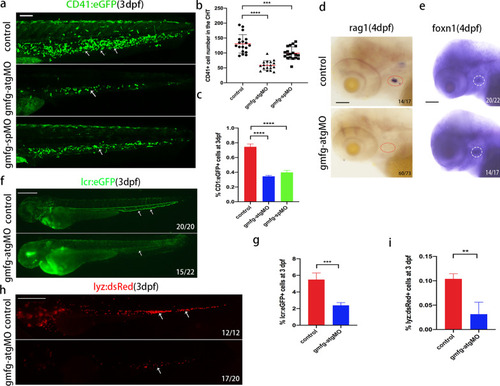
Loss of gmfg impairs the differentiation potential of HSPCs. a Maximum projections of 3 dpf cd41:eGFP transgenic embryos injected with control MO, gmfg-atgMO, and gmfg-spMO. White arrowheads denote cd41 + cells in the CHT. All views: anterior to left. Scale bar, 100 μm. b Enumeration of cd41 + cells shown in (a). Bars represent mean ± SD of control (n = 18), gmfg-atgMO (n = 17), and gmfg-spMO (n = 18). ***p < 0.001, ****p < 0.0001. c FACS analysis showing the percentage of cd41 + cells in the dissected trunk and tail of control, gmfg-atgMO, and gmfg-spMO at 3 dpf (n = 3). ****p < 0.0001. d and e WISH for the T lymphocyte marker rag1 (left, red dotted line circle) and thymic epithelial marker foxn1 (right, white dotted line circle), respectively, in embryos injected with control MO and gmfg-atgMO at 4 dpf. All views are lateral, with anteriors to left. Scale bars, 50 µm. f and h lcr:eGFP and lyz:dsRed transgenic embryos injected with control MO and gmfg-atgMO were visualized at 3 dpf. Scale bars, 500 μm. g and i FACS analysis showing the percentage of lcr + erythrocytes and lyz + neutrophils in whole embryos of control and gmfg-atgMO groups at 3 dpf (n = 3). **p < 0.01, ***p < 0.001. Numbers at the lower right corner of the picture represent embryos with displayed phenotype/whole embryos |