
- Title
-
Ethanol Preference Leads to Alterations in Telomere Length, Mitochondria Copy Number, and Antioxidant Enzyme Activity in Zebrafish Brains
- Authors
- Moraes, I.B., Paiva, I.M., Moreira-Júnior, R.E., Sartori, B.M., Franco, R.R., Espindola, F.S., Murgas, L.D.S., Brunialti-Godard, A.L.
- Source
- Full text @ Front Biosci (Landmark Ed)
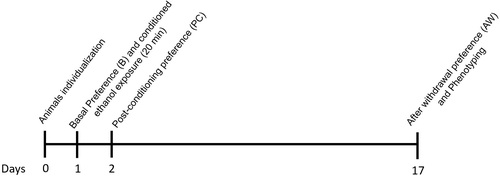
Experimental design. After an adaptation period, the CPP test was performed on day 1 considering the established protocol: First, Basal Preference was determined, followed by ethanol conditioning. On the day 2, the Post-conditioning Preference test was perfomed. Lastly, After-withdrawal Preference was determined on day 17 (Modified from Paiva et al. [7] (2020)). |
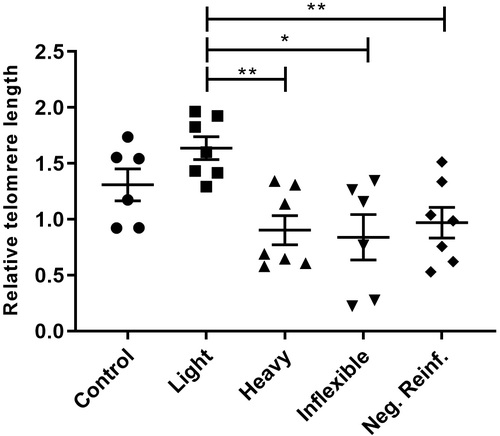
Relative telomere length in brains of adult zebrafish submitted to CPP testing and distinguished by phenotypes of ethanol preference. One-way ANOVA followed by a Tukey’s post hoc test. Data are expressed as the mean and standard error of the mean ( |
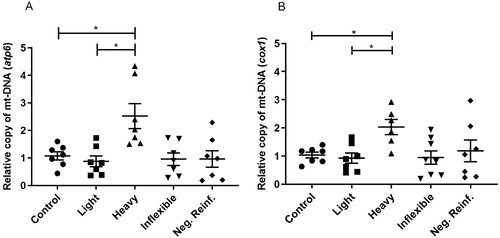
Relative mtDNA copy number in brains of adult zebrafish submitted to CPP testing and distinguished by ethanol preference phenotypes. (A) Results for atp6. (B) Results for cox1. One-way ANOVA followed by a Tukey’s post hoc test. Data are expressed as the mean and standard error of the mean ( |
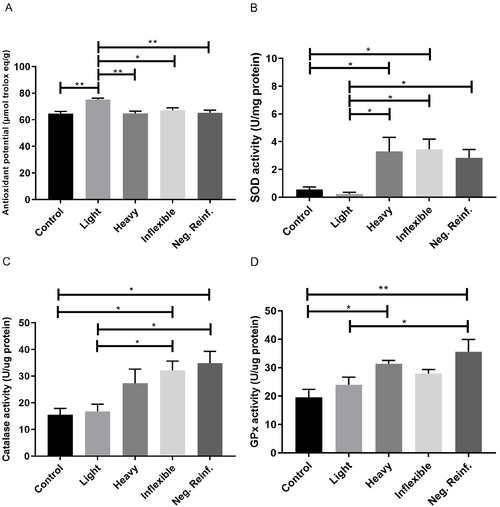
Biochemistry analysis of brains of adult zebrafish submitted to CPP testing and distinguished by ethanol preference phenotypes. (A) Total antioxidant potential by the FRAP method. (B) SOD activity. (C) Catalase activity. (D) GPx activity. One-way ANOVA followed by a Tukey’s post hoc test. Data are expressed as the mean and standard error of the mean ( |
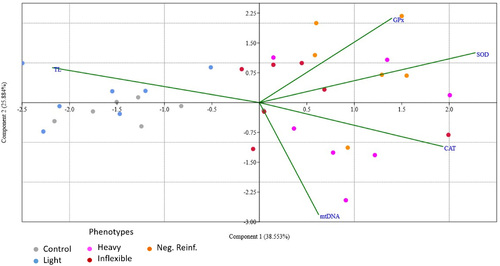
Distribution of the control and preference data and its relationship to the molecular and biochemistry parameters that were analyzed (TL, mtDNA, CAT, SOD, and GPx). Colors indicate the control and four phenotype groupings (Light, Heavy, Inflexible, and Negative Reinforcement). Arrows indicate the parameters analyzed. The proximity of phenotypes to each line indicate which parameters are related to the variance of data in each phenotypic category. TL, telomere length; mtDNA, mitochondrial DNA copy number; CAT, catalase; SOD, superoxide dismutase; GPx, glutathione peroxidase. |

Correlation between telomere length and the results for enzyme activity levels for (A) CAT; and (B) SOD. There is a tendency for higher enzyme activity associated with lower telomere length and this relationship is approximately linear, as indicated by the dotted line. Coefficients (r) were calculated by Pearson’s correlation model. CAT, catalase; SOD, superoxide dismutase. |