
Image
|
Figure Caption
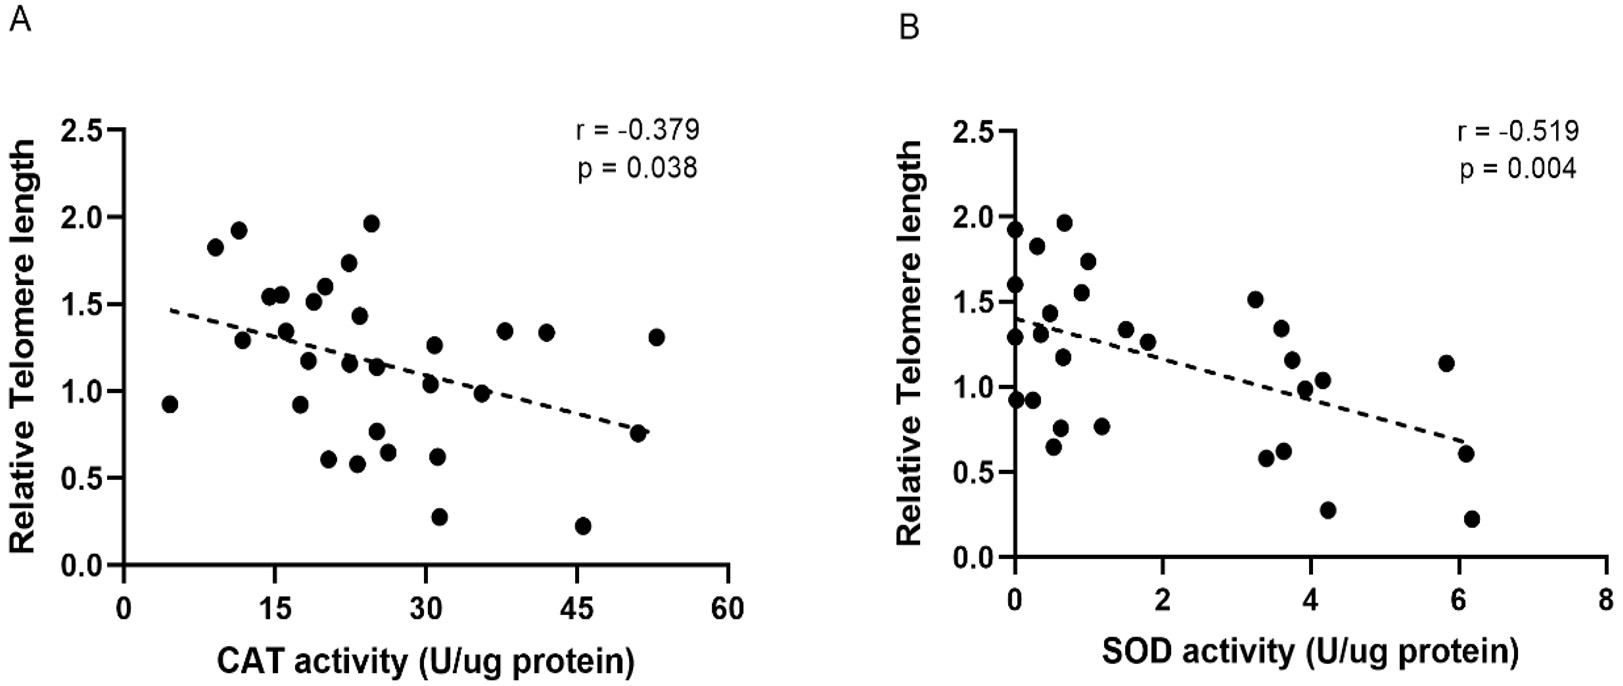
Fig. 6
Correlation between telomere length and the results for enzyme activity levels for (A) CAT; and (B) SOD. There is a tendency for higher enzyme activity associated with lower telomere length and this relationship is approximately linear, as indicated by the dotted line. Coefficients (r) were calculated by Pearson’s correlation model. CAT, catalase; SOD, superoxide dismutase.
Acknowledgments
This image is the copyrighted work of the attributed author or publisher, and
ZFIN has permission only to display this image to its users.
Additional permissions should be obtained from the applicable author or publisher of the image.
Full text @ Front Biosci (Landmark Ed)