
Image
|
Figure Caption
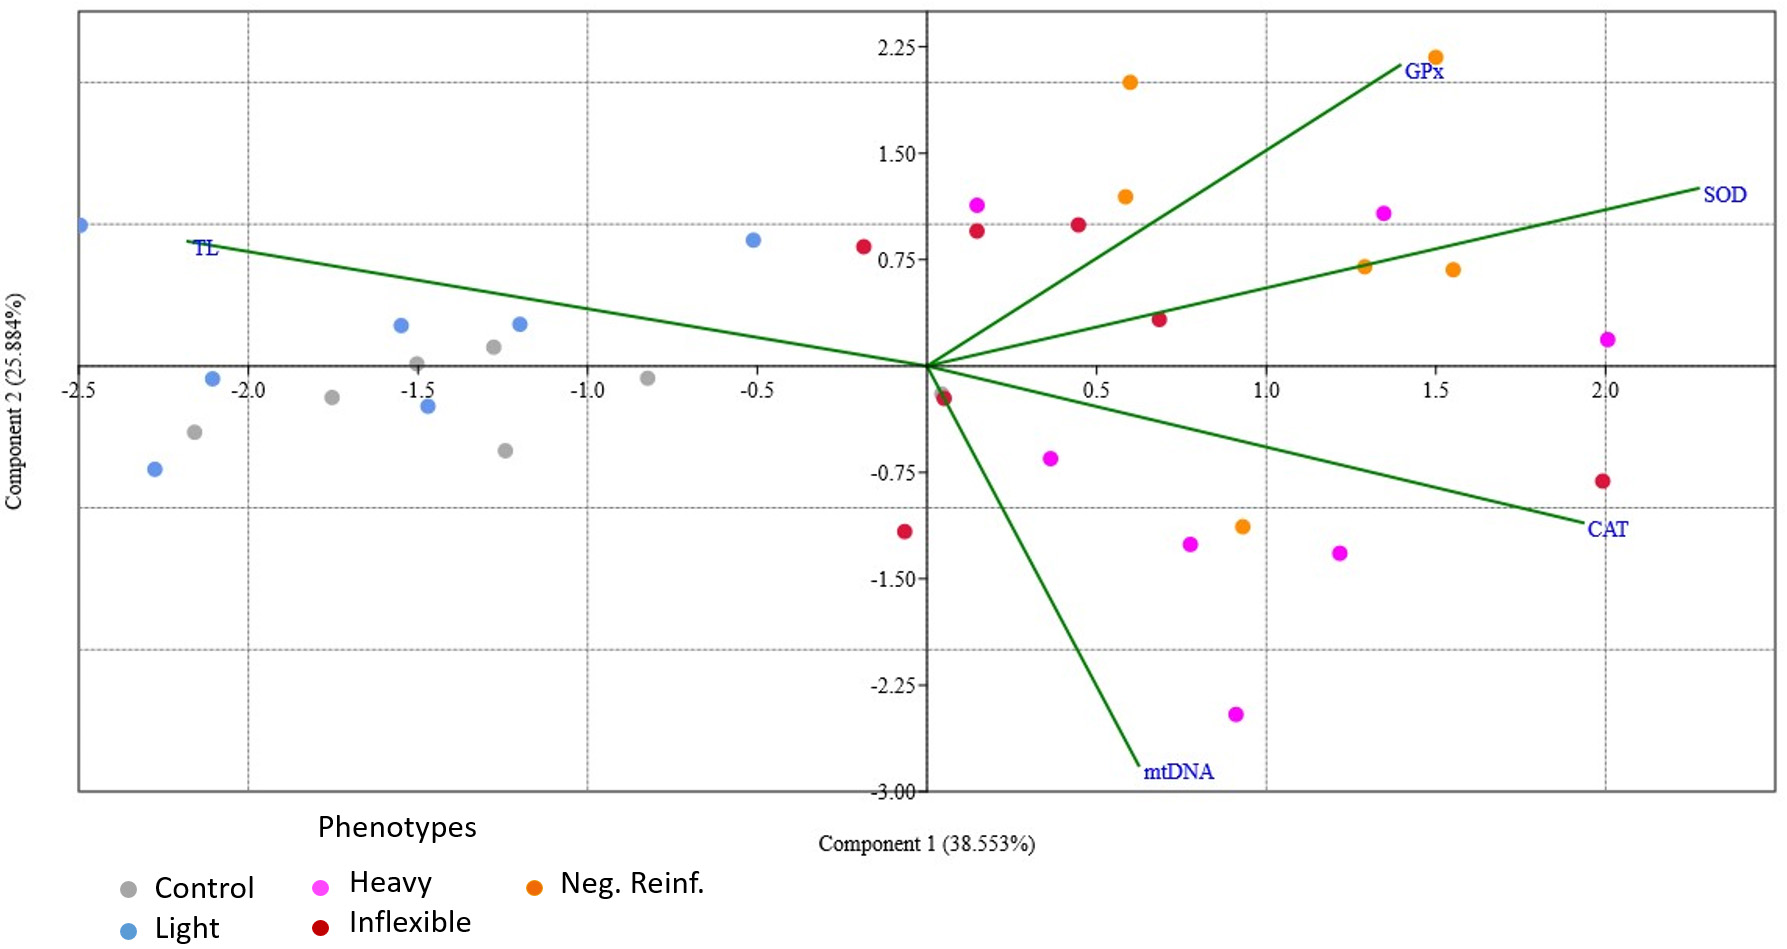
Fig. 5
Distribution of the control and preference data and its relationship to the molecular and biochemistry parameters that were analyzed (TL, mtDNA, CAT, SOD, and GPx). Colors indicate the control and four phenotype groupings (Light, Heavy, Inflexible, and Negative Reinforcement). Arrows indicate the parameters analyzed. The proximity of phenotypes to each line indicate which parameters are related to the variance of data in each phenotypic category. TL, telomere length; mtDNA, mitochondrial DNA copy number; CAT, catalase; SOD, superoxide dismutase; GPx, glutathione peroxidase.
Acknowledgments
This image is the copyrighted work of the attributed author or publisher, and
ZFIN has permission only to display this image to its users.
Additional permissions should be obtained from the applicable author or publisher of the image.
Full text @ Front Biosci (Landmark Ed)